The Sunspot-Earthquake Connection

Raffaele Bendandi was an earthquake forecaster from Italy who claimed to have predicted the great Avezzano earthquake of January 13, 1915 which killed 30,000 people (he had listed it in his notes but he never published his prediction). He became famous in his native country when he registered a prediction with a notary of an earthquake to occur on January 2, 1924, which actually occurred on January 4, 1924 in the province of Le Marche, Italy (I was not able to locate an earthquake of any significance in that area for that date, but did find a 4.8 magnitude one in Senigallia on January 2, 1924, so perhaps his predicted date was for the 4th and it happened 2 days before instead of after). At the time, Italy's leader Benito Mussolini praised him, but also decided to ban him from predicting in 1928, thinking him a threat to tourism. Bendandi unfortunately never published his methods, but did produce a book about the relationship between earthquakes and solar activity. That is what we will explore now.
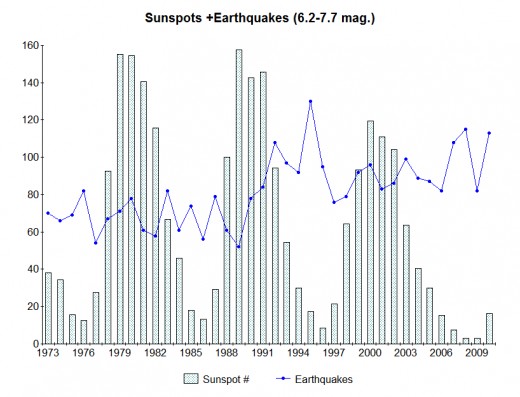
In the past I have recognized a pattern of earthquakes appearing more frequently during periods when sunspots are at a minimum. This does not appear to be the case necessarily for the largest earthquakes of from 8.5 or higher, but for quakes in the 6.2 to 7.7 range it can be striking as seen in the chart shown here. Any peaks in seismic activity during the first two periods of minimum solar activity shown does not appear to be significant, but something happened just following the maximum of solar activity displayed in the middle of the chart. From 1992 through 1996, but especially 1995, things picked up in an obvious and mysterious manner. I thought perhaps that a worldwide monitoring system was put in place in 1992, but that began in 1975 and was wide in its scope well before 1992.
Whatever was the cause for the marked increase in activity from 1992, it is still a reality. There has been another significant increase in such seismic events from 2007 to 2011 (with the exception of 2009). Could this be a reflection in something that has changed in regards to the solar output? Within the last few years the sun has displayed an unusually low and prolonged solar minimum. Many scientists are thinking that perhaps we are about to enter a few decades of very low sunspot activity. This is what happened during the Maunder Minimum which started in the year 1645 and ended in 1715. In a previous hub page it was learned of a peak in seismic activity during the 1675 to 1699 period (but especially from 1687-1695), so there may be a connection between the two phenomena. Also, after reviewing earthquakes from the Catalog of Significant Earthquakes (NOAA) that occurred from 1650 through 1674, I located at least 15 quakes that caused a minimum of 800 deaths (most not displayed in the previous chart because they did not include time of occurrence; if they had listed such then a peak also for 1650-1674 would have shown on the graphic).
Checking another source, this time a catalogue entitled "Deadly Earthquakes in the World: 1500-2000" by Tokuji Utsu (pgs. 691-717 from the text of the "International Handbook of Earthquakes and Engineering Seismology" edited by William Hung Lee, Paul Jennings, Carl Kisslinger, and Hiroo Kanamori), 34 quakes were listed for the 70 year period from 1645-1714 (all with at least 800 deaths). The 70 years before that had 24 quakes and the 70 year period after that had 15.
I have expanded the period of time before and after the maunder minimum in this study and have done a more thorough search using the expanded "Catalog of Damaging Earthquakes in the World" also compiled by Tokuji Utsu (1928-2004), formerly a professor of the University of Tokyo, that can be searched at this URL: http://iisee.kenken.go.jp/utsu/index_eng.html
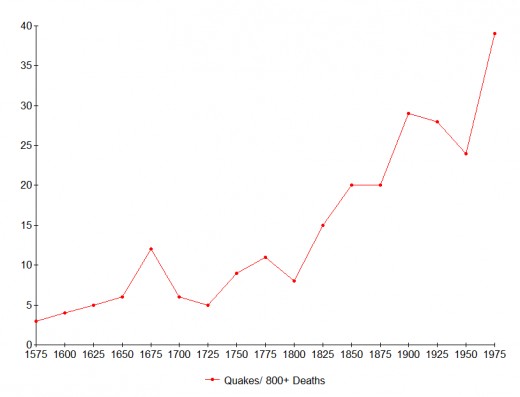
In the graphic below a clear increase in earthquake activity (for quakes with at least 800 casualties) is demonstrated for the period of 1645-1714. In this list, duplicates, mythical reports, and deaths from storms were weeded out.
The last 35 years shows what looks like a significant increase in earthquakes, but that is most likely due to marked improvement in the tracking of quakes during that period of time (1820-1854).

Four out of the last five years has displayed increased seismic activity across the board and, besides being in the midst of a Great earthquake storm, we have also been experiencing an increase apparently related to solar minimum. In theory, with the exception of the huge 8.5 or greater quakes, things should now cool down a bit for a few years but, as mentioned earlier, the rules may be changing if we are entering into a prolonged state of inactivity when it comes to sunspots on the face of our sun.
If we do enter into such a minimum period for a few decades, then greater seismic events should be felt during that period (if what happened during the Maunder Minimum is any indication). So my forecast is, we will most likely see 8.5 or larger earthquakes in greater numbers than normal for the next seven years. At the end of that period will be the next solar minimum, so earthquakes below that range should pick up for about three years. We should expect the pattern of increases in such quakes to continue around the time of solar minimum fairly consistently for a while. If the sun does go into a hibernation period (not likely to begin until at least 22 or as much as 35 years from now), quakes in the 6.2-7.7 range (and likely higher) should pick up in frequency by a significant amount (at least 30% more than would be typical).
Copyright © 2012 Joseph W. Ritrovato


