The Demand Curve

What is a Demand curve?
Good question!
The demand curve quite simply helps illustrate the relationship between the price and quantity demanded of a good or service in the market. Here we see a negative or inverse relationship between price (P) and quantity (Q). This is because when the price is low, people usually demand more of that good, and likewise when the price is high people tend to buy less of that good and therefore we see a reduction in total demand.
This is best explained with an example!
Price Movements- Golden Star Electronics
Lets consider a large competitor in the consumer electronics market which we shall name Golden Star Electronics. Golden Star's lead product is an incredibly advanced smart phone that has an in built projector, can produce holograms and all sorts of other crazy things. Now, let's say that the firm currently sells its lead smart phone at a price of $1,000 and as a result, the market demands 10,000 units at this given price.
Here we can denote quantity and price as (Q1, P1) where Q1 = 10,000 and P1 = $1,000.
Simple so far, right?
Now, lets consider a price movement on the demand curve which in this example will move downwards; this we call an extension of demand, and the opposite is termed contraction of demand. If for whatever reason Golden Electronics smartphones price were to be reduced by 10% to $900, then demand would increase to let's say, 12,000. This is what would happen according to the conventional law of demand in economics, which we stated at the beginning; when price is low, demand increases, and when price is high demand reduces.
So what has happened?
We saw Q1 = 10,000 and P1 = $1,000
And now we see that Q2 = 12,000 and P2 = $900
In other words, P1 > P2 = Q1 > Q2
Price Movement of Demand
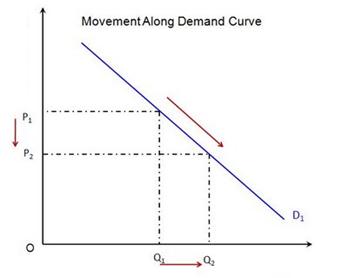
Here we can see diagrammatically what this example would look like if plotted on a graph. Golden Star' initial price was set at $1,000 (P1, Q1), then price dropped to $900 (P2, Q2).
What causes a price movement on the Demand Curve?
Good question. At this point it's important to understand the difference between a price movement along demand curve, and a shift of the demand curve. When we talk about a simple price movement along the demand curve, we simply refer to the price of a good or service moving up and down the curve (Golden Star Electronics example). When we talk about a shift of the demand curve, we refer to the entire curve shifting up or down (left or right) and can be best demonstrated on a supply and demand curve graph.
The price of a good can be changed depending on what as firm selling that good deems is the most competitive price. If for example a firm in the soda market sees a new entrant to the market, i.e. a new competitor, it may feel the need to lower prices in order to compete for customers (reduced price = increased demand). At the same time, it could choose to increase prices if the entrant to the market is offering a premium soda at a slightly higher price. By upping your price to match or slightly undercut the new competition tells the market that you can also produce premium soda. Whereas if you were to sell your soda at the same old price, the market may deem your product as being inferior and of lesser quality since you're able to sell at a cheaper prices. Of course there are many more variables to consider when we talk about the price movements on the demand curve, but this is just a simple example.
Shifts in the Demand Curve- Golden Solar Power
Now that we've covered price movements along the demand curve, we shall now look at the shifts in demand on the demand curve.
We saw in the previous example that an increase in price typically reduces demand, and a reduction in price increases demand. This is a relatively simple relationship, whereas demand shifts can occur for a number of reasons and can be very difficult to estimate the effects of.
In this example we will consider a company selling the most efficient solar panels currently being offered to the solar power market; Golden Solar Power. Let's say for this example that Golden Solar's most optimum selling price for its lead solar panel's is $5,000 and current demand at that given price is 100,000 units.
Again, we can denote price as P1 = $5,000 and quantity demanded as Q1 = 100,000 units.
Now let's suppose that the latest weather forecasts have predicted a cloudy and gloomy summer for the year ahead. In this case, would we expect the demand curve to shift to the left, of the right? Think about it.
The answer is, to the left. Why you ask? Well, in order for solar panels to be most effective and cost efficient, there needs to be direct sunlight. Although solar panels don't need direct sunlight for them to work, when operating in cloudy or gloomy conditions, such weather can diminish the generating capacity of the panels by up to 50%. So what does this mean for our demand curve? Well it means we will see a leftward shift because consumer demand will fall since they won't see the full benefit. The contrary would happen however if it was predicted that this years summer was going to be full of bright sunshine. We would then hope to see a rightward shift in the demand curve since overall demand has increased while prices remain constant.
Going back to our example, we would see P1 remain constant at $5,000, but Q1 = 100,000 would reduce to Q2 = 50,000. That's if weather forecasts were for overcast cloudy conditions.
However, if weather forecasts were for bright sunshine, then we would see Q1 = 100,000 shift to Q3 = 150,000 units since overall demand would increase.
Leftward and Rightward shift in demand
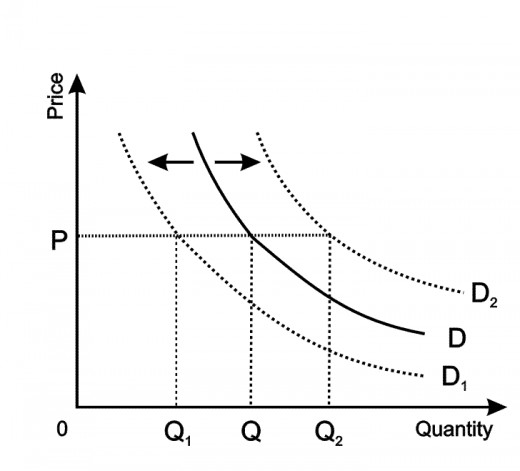
Once again we can see these effects diagrammatically.
In this graph, it's clear that regardless of the shift in demand, whether right or left, prices remain constant, however quantity demanded is what changes. Applying our Gold Solar Power example to this graph, in the case of cloudy weather, we would see demand shift from Q to Q1 or, from the demand curve D to D1. The opposite would occur however in the case of sunny weather, seeing demand jump from Q to Q2, or D to D2.
What else causes Demand Shifts?
There are many things, not just weather conditions that can affect the the behaviour of demand for goods and of course different causes affect different types of businesses more than others. See below for some examples of the causes of a rightward and leftward shift of the demand curve.
Rightward shift:
- Increase in consumer income
- Consumer preferences and tastes
- Expectations
- Advertising
- Product/Service quality
- Substitute and Complementary goods
- Macroeconomics factors including reduction in interest rates which would discourage people from saving, therefore spending more.
- Increase in population
- Changes in population composition
Leftward Shift:
- Decrease in consumer income
- Consumer preferences and tastes
- Low quality goods, bad publicity
- Decreased population
- Changes in population composition
What's next?
In the next article we shall cover the laws of supply in economics, and then finally how the laws of supply and demand can be combined to derive an equilibrium price and equilibrium quantity in the market.
If you have any questions regarding what has been said in this article, don't hesitate to ask!


