ACA - MAJORITY of Americans FAVOR OBAMACARE ... Or Something More Liberal !! [225*8]
THERE! I SAID IT AND I AM STICKING TO IT, with the help of the latest CNN/ORC poll on the Affordable Care Act. And, yes, it is the same poll with the media, be it CNN or Drudge, and politicians (mainly Republicans) cite with they report just the opposite results ... that most Americans Oppose Obamacare?? Interesting, opposing views from the same survey, how can this be? Simple, it is all in how you "ask" and "report" the question.
You see, paraphrased, the question asked was "Do you 'Favor' or 'Oppose' Obamacare?" Pretty straight-forward it would seem, don't you think? And it is ... until you read the responses and it immediately gets very cloudy. The reason is one of the responses can be interpreted in two ways, 1) opposing THIS particular healthcare reform bill or 2) favoring a more liberal law than the one passed, just not this one in its current form.
The Right and the Media just take the word Oppose (because it isn't liberal enough) without interpreting its meaning, the first possibility. People like me, as former statisticians, and those on the Left take the second meaning; which leads to an entirely different set of results than the ones reported in the mainstream (or otherwise) media; you know, that organization which has great influence on what we take as "truth".
DETAIL IS THE KEY TO TRUE UNDERSTANDING!
I HAVE ACTUALLY WRITTEN ABOUT THIS in another Hub, but it was part of a larger whole. In this Hub, I focus only on the Affordable Care Act survey numbers and how the media OUGHT to be interpreting them for you given that it is not common for those who are not Meyers-Briggs _NTPs or _NTJs (if you look it up, or visit my other hubs on Meyers-Briggs, you will see why).
The CNN/ORC survey, conducted between Dec 16 and 19, asked four Obamacare questions with the first two being related:
- Q.21 As you may know, a bill that makes major changes to the country's health care system became law in 2010. Based on what you have read or heard about that legislation, do you generally favor or generally oppose it?
- Q.22 Do you oppose that legislation because you think its approach toward health care is too liberal or because you think it is not liberal enough?
- Q 23: From what you know of that legislation, do you think you and your family will, in general, be better off, worse off, or about the same when the provisions of the health care law take effect next year?
- Q 24: From what you know of that legislation, do you think you and members of your family will or will not be able to receive care from the same doctors you see now?
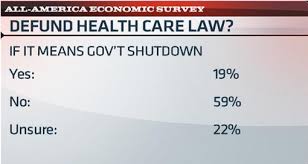
What the media and those who oppose Obamacare have done is trumpet the results of Q 21 WITHOUT taking into consideration the results of the "real" questing which is Q22!! Then that is done, you get the "misleading" results that have been splashed all over the headlines as 35% of American's support the ACA while 58% oppose it. Therefore, the Right trumpets, "all" Americans hate healthcare reform and especially Obamacare as it is written. Their solution is to dump it and go back to the way that worked so well for so many years.
Of course, us NTs know that is a lie. We know it's a lie because we looked at the results of Q 22. When asked if you "oppose" ACA because it "isn't liberal enough" you are actually asking if you think the ACA ought to be made even more robust than it already is, you are saying that Obamacare is "too weak" as it stands right now. That is NOT the same things as saying you oppose Obamacare because it is "too liberal", When read this way, then the "isn't liberal enough" becomes a "Pro Healthcare" result and you can "rightly" say that 50% of American's FAVOR Obamacare or something more liberal and only 43% actually oppose ACA because it is too liberal; quite a switch in perception, would you say.
Next let me offer a more realistic look at the results of CNN's latest survey, the news they should have reported.
THE BASIC FACTS
GENERAL POPULATION
| REPORTED FAVOR/OPPOSE RESULTS
| RESULTS BASED ON WHO FAVORS REFORM AND THOSE WHO DON'T
|
|---|---|---|
FAVOR
| 35%
| 50%
|
OPPOSE
| 48%
| 43%
|
NOT SURE
| 8%
| 8%
|
TABLE 1
THE REAL NUMBERS
OBAMACARE IS
| TOTAL
| TOO LIBERAL
| JUST RIGHT
| NOT LIBERAL ENOUGH
|
|---|---|---|---|---|
FAVOR REFORM
| 50%
| 35%
| 15%
| |
OPPOSE REFORM
| 43%
| 43%
| ||
NOT SURE
| 8%
|
TABLE 2
So. who wants to argue that the surveys show most Americans actually WANT some sort of healthcare reform? Why isn't the news media presenting the information in this manner? They have had years of opportunity for it has always been this way!
Sep 2013 was the worse poll with only 49% favoring reform, 39% opposing it, and 13% undecided. If you go back to Mar 2010, the results are still about the same with 52% for, 43% against, and 5% undecided.
Let me know, please, if there is any other way to interpret this data once you know the story behind the misleading top line.
The CNN/ORC poll asked a lot of demographic questions so as to better understand what is driving the results. I want to discuss some of them in this Hub to dig into what lies at the heart of what you observe. Let's start by considering gender.
WHAT DO MEN AND WOMEN THINK?
MEN
| WOMEN
| |
|---|---|---|
TOO LIBERAL
| 48%
| 37%
|
JUST RIGHT OR NOT LIBERAL ENOUGH
| 47%
| 53%
|
UNDECIDED
| 5%
| 10%
|
TABLE 3
NOW WE CAN START DISCERNING DISTINCT DIFFERENCES in who is for and against healthcare reform. Just a quick glance at Table 3 tells you it is men who are most against healthcare reform; by a sizable margin. This would be expected, I would think since women are the caregivers in our society and more sensitive to the needs of others.
What about Race? Now the difference is going to be significantly starker as you will see in Table 4.
WHAT ABOUT RACE?
WHITE
| NON-WHITE
| |
|---|---|---|
TOO LIBERAL
| 55%
| 17%
|
ABOUT RIGHT or NOT LIBERAL ENOUGH
| 38%
| 75%
|
UNDECIDED
| 7%
| 8%
|
TABLE 4
CAN YOU TELL, USING TABLES 3 AND 4, WHO IS DRIVING THE 43% OPPOSED to reform? If you say white males, you would be right. It goes without say that those most likely to not have health insurance would be the same ones who would support healthcare reform while the reverse would also be true. Given white men are the most insured with white women coming in second, to believe they would be naturally inclined to support reform would be foolish.
How does Party affiliation and political leaning enter into the mix?
DEM
| IND
| REP
| LIB
| MOD
| CON
| |
|---|---|---|---|---|---|---|
TOO LIBERAL
| 13%
| 46%
| 78%
| 12%
| 36%
| 68%
|
ABOUT RIGHT or NOT LIBERAL ENOUGH
| 78%
| 46%
| 16%
| 78%
| 55%
| 28%
|
UNDECIDED
| 9%
| 8%
| 6%
| 10%
| 9%
| 4%
|
TABLE 5
YOU CAN REASONABLY CONCLUDE THE FOLLOWING FROM the information in the previous five tables: 1) The first, which is a bit off the subject but becomes obvious when looking at Table 5, taking into account Table 2. And that is self-described Independents lean to the Right and self-described Moderates lean to the Left. We think of Democrats as liberals and Republicans, Conservative. One would think then that Independents would be associated with Moderates; but as we just saw, that isn't necessarily true. What do you make of that? 2) The other is that those who so vociferously and bitterly oppose health reform ar white, male Conservatives, the exact cohort which is the core of today's Republican Party.
Other interesting results regarding this question are:
- 59% of those earning under $50,000 prefer healthcare reform compared to 43% for those more well off
- Attending college did not increase or decrease the preference for healthcare reform, it was 50% in both cases
- The only age group where those who oppose healthcare reform roughly equals those who support it is between 35 and 49. It should be noted that the plurality of those 65 and over actually oppose healthcare reform; how much of that opinion has to do with Republican propaganda regarding the harm Obamacare will allegedly do to Medicare which is what covers this age group.
- Opposition to reform is highest in the West at 47%, as well as suburban and rural areas at 48% each. Considering the conservative political orientation and concentration of Whites in these areas, those results are understandable.
- Finally, what you feel about the Tea Party plays a large role in your support of opposition of healthcare reform. If you support the Tea Party, then there is a 75% chance you oppose reform, while if you oppose the Tea Party, then the chance you oppose reform drops to 15%. That statistic, by itself, is extremely telling about the worldview of the Tea Party members!
WHAT DO YOU THINK ABOUT THIS?
Do you consider the current healthcare reform legislation (Obamacare)
ARE YOU BETTER OFF?
THE NEXT QUESTION, Q 23, IS ARE YOU BETTER OFF with the new legislation rather than what was in place prior to Obamacare? The possible answers are "No", "Yes", "About the Same". and "Not Sure". For purposes of this discussion, I will combine "Yes" and "About the Same" because the rhetoric being flung around today is that the ACA is going to be a disaster and will make things much worse than what they used to be.
When you peruse the following tables you should come away convinced that it just ain't so; that by and large, Americans do not see Obamacare as an abomination now nor in the future. For example,
WITH WHAT YOU KNOW ABOUT OBAMACARE, DO YOU THINK YOU WILL BE
MEN
| WOMEN
| WHITE
| BLACK
| |
|---|---|---|---|---|
BETTER OFF OR ABOUT THE SAME
| 55%
| 57%
| 47%
| 76%
|
WORSE OFF
| 43%
| 41%
| 52%
| 22%
|
NOT SURE YET
| 2%
| 2%
| 2%
| 3%
|
TABLE 6
WHAT STANDS OUT IN THIS SURVEY is the disparity in who thinks their lives won't change or will get better with Obamacare. Men, Women, and non-Whites all feel fairly to very strongly a neutral or positive is not a bad thing. Only Whites feel the opposite! Why is that?
Well, consider who constitutes the vast majority of Republicans, Conservatives, and Teal Party members .... white males. Then know that 70%, 63%, and 70%, respectively, believe they will be Worse Off, under ACA. Compare that with a disapproval rate of between 19% and 45% for all other groups. It is easy to conclude, therefore, that most of those who make up the White disapproval rating are Conservative Republican Tea Party supporters; the rest of America believes just the opposite although you wouldn't assume that from the news media reports and Republican rhetoric.
Other tidbits on who thinks not much will change or even get better are:
- All age groups except 35-49 and 65+, who's Better-Not Better states are 51%-49% and 49%-50%, respectively
- Income under $50k vs over $50k: 61%/36% and 53%-46%, respectively
- Didn't attend college vs those that did: 53%/44% and 58%/41%, respectively.
- Only in the Midwest, South, and rural regions do positive ratings drop; to 50%, 49% and 47%, respectively.
FOR BETTER OR WORSE
Do You Think You and/or Your Family Will Be Better-off With a Fully Functional Affordable Care Act
WILL YOU BE ABLE TO KEEP YOUR DOCTOR?
CONSERVATIVES MADE GREAT HAY regarding the poetic license President Obama took in trying to assure American's that ACA was not designed to prevent you from seeing the doctor you are used to seeing. Any intelligent person without an agenda would know that, or similar, utterances cannot be ironclad; just like they know that any advertisement they see or hear for a commercial product is likewise hyped up to some degree. To complain that Obama lied is simply being political, disingenuous, and probably hypocritical.
The vast majority of Americans seem to think so as well given that all demographic groups, except Republicans and Conservatives think they can keep their own doctor under Obamacare.
Table 7 reflects this notion.
YES, I CAN KEEP MY DOCTOR
MEN
| WOMEN
| WHITE
| NON-WHITE
| |
|---|---|---|---|---|
KEEP MY DOCTOR
| 61%
| 61%
| 55%
| 73%
|
LOSE MY DOCTOR
| 35%
| 36%
| 40%
| 25%
|
NO OPINION
| 4%
| 3%
| 4%
| 2%
|
TABLE 761%
I WISH ONE OF THE CHOICES HAD BEEN, "DON'T CARE IF I KEEP MY OWN DOCTOR", but it wasn't (I will cure that with my own poll). But, as you can clearly see, the percentage of Americans who don't buy into the "can't keep your doctor" litany is virtually everybody who isn't Republican and/or Conservative. Even with the latter cohort, a bare majority/plurality, 51% and 48%, respectively, believe thay can't keep their own doctor; an extremely surprising statistic.
KEEPING YOUR DOCTOR
Do You Think You Will Be Able to Keep Your Doctor Once the ACA Is Fully Functional?
SO, WHAT DOES IT ALL MEAN?
PERSONALLY. I THINK OBAMA AND THE DEMOCRATS are getting worried about something close to nothing. Consider these two statistics:
1) Americans who identify themselves as conservative or very conservative constitute 41%, as of a Gallup poll conducted in May 2013; the same poll suggest that 37% are moderate; while that vile group of liberals who are out to destroy America, and doing a very effective job of it, according to the Right, amount to a whole 16%; and
2) Those who identify themselves as Republican or Republican leaning make up 42% of Americans in the latest Dec 2013 Gallup poll.
In reconciling those statistics with the ones in Tables 1 through 7, one can easily discern that approval of healthcare reform is ideologically-based rather than a general belief amongst Americans. As conservatism declines in America, approval of ACA will increase.
REALITY SURVEY #1
Did You Purchase Insurance Through the State or Federal Insurance Exchanges
REALITY SURVEY #2
IF YOU BOUGHT THROUGH AN INSURANCE EXCHANGE, Did you do it because ...
DEMOGRAPHIC SURVEY #1
Politically, do you lean
DEMOGRAPHIC SURVEY #2
Are You
AMAZON ON OBAMACARE
© 2013 Scott Belford


