The Three Degree World
This Hub summarizes in a table the expected and possible effects from three Celsius degrees of warming of the global average temperature above pre-Industrial values. The summary is drawn from Six Degrees, by Mark Lynas, with updates to be posted as possible. (Six Degrees was published in 2008.)
Note: The first update, incorporating information from the final draft of the Technical Summary of the IPCC Assessment Report 5, was posted 12/9/2013. It is headlined below the summary table.
The three degree world is less familiar than worlds with less extreme warming; whole nations are at risk of disappearance. It's a degree of warming which, by consensus, represents the point where damage begins to be extremely serious, and at which less and less corresponding benefit from climate change can be derived. Here's the list of Lynas's expected impacts.
Section
| Content
|
|---|---|
What Every Batswana Wants, p. 123
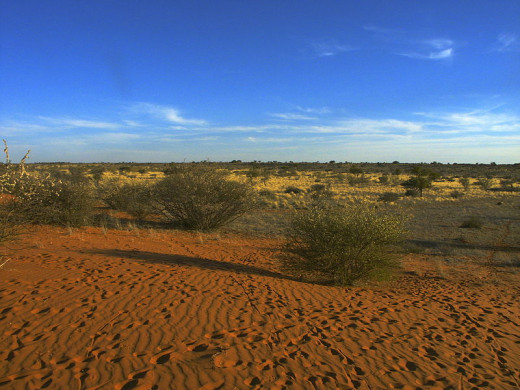
| Every Batswana wants rain--which is just what they will not get in a 3 C world. The Kalahari is likely to revert to "true desert" again, with Botswana to be buried under shifting dunes--possibly ca. 2070.
|
Perils of the Pliocene, p. 127
| Whereas the Eemian is the analog for a 2 C world, a 3 C world more closely resembles the Pliocene, ca 3 Myears BP. Pliocene CO2 levels were in the range of 360-400 ppm, suggesting that that is where contemporary levels may ultimately take us.
|
The Christ Child Returns, p. 134
| The effects of the 1912 El Nino as analog for future. Will warming bring more frequent or persistent El Ninos? This could be highly destructive.
|
The Death of the Amazon, p. 137
| Cox et al, 2000, considered. By including fast carbon cycle feedbacks, the team showed that 3 C could possibly reverse the sign of net carbon flows between atmosphere and land. Dying and decomposing plants now act as source of carbon, not a sink. Warming in 2100 increases from 4 C to 5.5 C. Several studies since have reached similar conclusions. Moreover, the process could be accelerated by human deforestation of the Amazon.
|
Australia's Ash Wednesday, p. 143
| In a 3 C world Australia will suffer greatly from drought and fire, affecting food production to the point where life becomes "increasingly untenable."
|
Houston, We Have A (Hurricane) Problem, p. 147
| A 3 C world could mean super-hurricanes with winds 6% greater and rainfall 18% greater--half a category higher than we experience today.
|
Dawn over A New Arctic, p. 150
| A 3C world will have little polar sea ice, especially in the Arctic. The consequences of this are hard to predict, but unlikely to be positive.
|
Mysteries of the Maya, p. 153
| Palenque and the Mayan 'overshoot' and collapse. Drought is likely to dominate Central America in a 3 C world, and 10s of millions now live there.
|
Mumbai's Monsoon, p. 157
| 60% of world crops depend upon the Asian monsoon. in the 3 C world it is likely to be both stronger and more variable, posing great challenges to farmers.
|
Where the Indus Once Ran, p.159
| Gradual loss of Himalayan glaciers will mean severe difficulties for many millions of Asians, since the Indus, Ganges, Brahmaputra, Mekong, Yangte and Yellow rivers all arise there. Pakistan is most at risk, since it is most dependent.
|
The Last Drops of the Colorado, p 163
| The interaction of drought, heat, loss of snowpacks and increasing wildfires could be devastating throughout the American west. Essentially, a permanent Dust Bowl could result.
|
Sinking the Big Apple, p. 167
| A prescient section, noting vulnerability of the greater NY area to flooding. Hurricane Floyd in '99 luckily weakened before making landfall, avoiding 'the big one.' Of course, we have since had Sandy.
|
Storms Gather in Europe, p. 169
| Thames Barrier, built in 1983, *did* take billions, but has been worth it, having been used 62 times to the date of writing. The 1953 flood catastrophe considered: similar flooding could be see "every few years by the latter part of this century." In southern Europe, "the Sahara will have jumped the Strait of Gibralter and begun marching north."
|
Africa's Fever, p. 172
| Malaria may increase in a warmer Africa, with Zimbabwe at particular risk.
|
Paradise Lost, p. 174
| The tabletop mountains ('tepuis') of Venezuela could lose a third of their unique species. THis is exemplary: fom 10 to 50% ofthe world's surface will see its usual climate disappear. From a third to half of all living species "will have joined the living dead" category by 2050 if global warming is over two degrees by that date.
|
Growing Food in the Greenhouse, p. 178
| Thermal tolerance thresholds and agriculture. In the north, there will be 'climate winners,' even in a 3 C world, though water will limit the benefits. But a net global food deficit is projected at 2.5 C. The tropics may become a source of large population outflows as people flee famine in huge numbers, leading to terrible political and military conflicts.
|
Update: Information from the AR5 Technical Summary
The IPCC released its final draft of portion of the Fifth Assessment Report dealing with the basic physical science in the fall of 2013. Included was a "Technical Summary," summarizing in 129 dense pages the salient results.
One result is that the "Three-degree World" could well be a reality by the time today's youngsters reach what is today considered to be retirement age. The figure below gives temperature projections based upon different choices humanity could make over the next decades, in the form of four "Representative Concentration Pathways," or RCPs. Skipping the details, they range from a future where emissions keep growing--RCP 8.5--to a future in which we find ways to actively reduce atmospheric concentrations of greenhouse gases--RCP 2.6.
The resulting temperature changes are illustrated below.
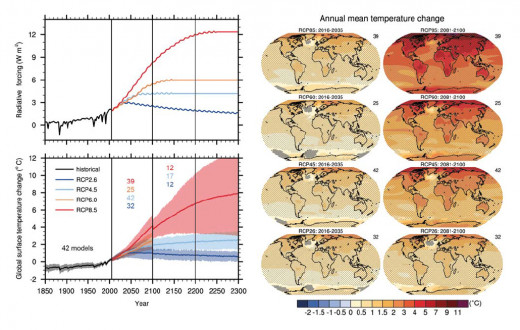
As shown in the graph at lower left, the most severe RCP, RCP 8.5, would easily result in reaching a three-degree world sometime shortly after 2050. (Lest that seem unduly pessimistic, note that at this point, humanity is on track to follow RCP 8.5, rather than one of the milder scenarios.) Even the next milder scenario, RCP 6.0, would likely reach 3 C by the end of the present century.
In order to consider what this implies for the "Three Degree" impacts envisioned in Six Degrees, let's consider the impact maps below.
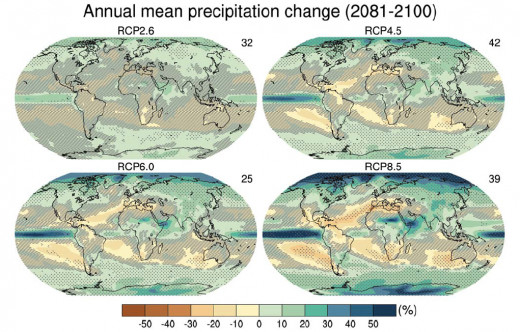
Here, the projected precipitation changes for 4 RCPs are given. Let's concentrate, for the moment, only on RCP 8.5. The color scale is given, but the hatching and stippling need explanation. The diagonal hash marks indicate areas where the changes are relatively small compared with natural variation--one 'standard deviation,' for the statistically-inclined. Contrariwise, the dots indicate a very large change--two standard deviations, or more.
Note that the strongest drying trends are in the Mediterranean basin, southern Africa--including Botswana--and, to a slightly lesser degree, the Caribbean, Central America, and Mexico. That is consistent Lynas's conclusions for those areas, as given in the table above.
But precipitation is only on aspect of the water cycle. With increased temperatures comes increased evaporation from the surface, be it water or soil. The Technical Summary examines this parameter as well, as well as others, in Figure 2 of their "Thematic Focus Element 1." But in the interest of brevity, I will skip to the panel 5, which gives precipitation minus evaporation (a measure of net drying of the surface) for the period 2081-2100, for RCP 8.5.
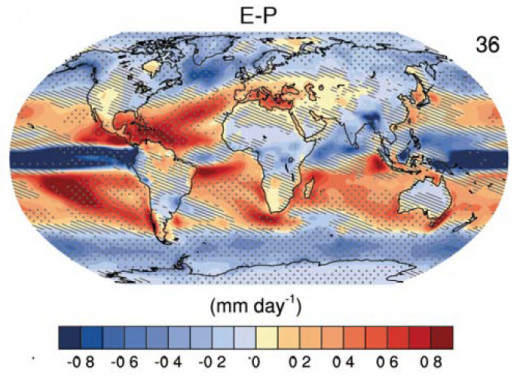
This metric shows in dramatic fashion the drying in mid-latitudes, especially in the Southern Hemisphere--although the effect in southern Africa appears more muted, and that in the Caribbean and Central America is extremely marked. And Australia actually appears to be moistening. Does that mean that Lynas's conclusions for that continent are now outdated?
Not necessarily. Consider another modeled parameter of the water cycle: soil moisture. It is affected not only by precipitation and evaporation, but by the distribution of precipitation and hence, the patterns of runoff: long-continued moderate rains saturate soils, whereas quick, violent rains may largely run off, leaving soil beneath the most superficial layer largely unmoistened.
Although the authors caution that modeling of soil moisture is subject to more uncertainty than other aspects of the water cycle, the results they present suggest that Australia may indeed suffer from seriously increased drought as a result of climate change. (Indeed, the last couple of years have seen remarkable heat waves and wildfire outbreaks there, suggestive of contemporary impacts in the "one degree world.")
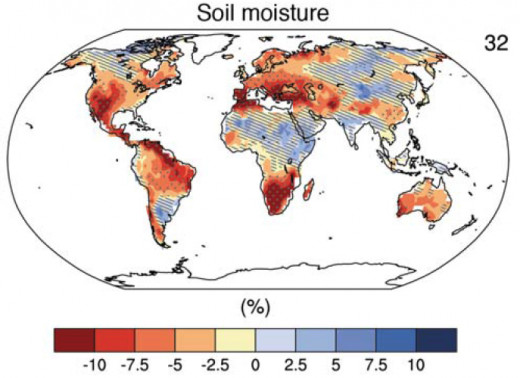
Also showing considerable drying in this metric is China--a highly populated area which is suffering from serious water shortages now. (Planners there are working on a mega-project to divert water from the south to the north. As reported in The Economist, October 12, 2013, "Beijing has the sort of water scarcity usually associated with Saudi Arabia: just 100 cubic metres per person per year." The average American uses 1600 cubic metres per year.) Lynas includes this issue in the Two Degrees chapter.
Of course, Americans in the Colorado river basin may need to do with much less in the future--as Lynas mentions, there is water stress there now, and as the soil moisture map shows, this is only likely to increase in the three degree world.
Drying of the Amazon is also evident--a matter of some weight, since this could trigger a 'tipping point' in which that vast areas turns from carbon sink into carbon source as vegetation, dying on a vast scale, releases its carbon to the atmosphere--and successor vegetation regimes permanently absorb less of it back again. The current science has equivocal news on this front: such a catastrophe is quite possible, says the Technical Summary, but not assured.
There is other news of this sort: changes to the Asian monsoon and to the patterns of the El Nino/La Nina remain quite uncertain as well. They may bite us, hard--or they may not. Mildly consoling, perhaps, but scarcely reassuring.
- Mark Lynas's "Six Degrees": A Summary Review
"Six Degrees" is a modern classic, outlining potential effects of various levels of global warming. It's summarized, evaluated, and updated here, with links to 7 supplementary Hubs.

