Futures Trading Part 3 - Leverage and the Power of Multiplication
Candle Charts

Leverage
Futures trading - Leverage and the Power of Multiplication
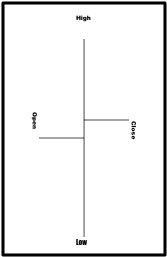
We speculators, who’ve never donned a pair of overalls in our lives, who’ve never seen an oil drill except maybe from a car, who wouldn’t know a good vein of platinum, copper, silver or gold if we bumped into one, want into the commodities market for two reasons: leverage and the power of multiplication.Leverage comes from the word “lever,” which is a tool that allows a small man to move a large object. Likewise, leverage is a financial tool that gives people the power to control a lot of assets with only a little capital. Some people need to pay only $10,000 down to buy a $200,000 house. The down payment on a car and insurance premiums are other examples of leverage in action. If you have an account with a stock broker, you probably purchase “on margin;” i.e., with leverage. You only use some of your own money to buy the stocks, and the brokerage lends you the rest, confident you will pay back later, when you sell the stocks. Your monthly credit card payments are all the leverage you need to keep Visa and Mastercard lending you money.Leverage is awesome, especially in the case of futures contracts. For a mere fraction of the actual cost of the commodity, you purchase the right to either buy or sell tremendous quantities of wheat, soybeans, corn or barley at a pre-fixed price, regardless of market fluctuations. In the example of wheat futures, for the piddling price of $1,293 (the “margin”), payable through futures brokers and a trader at the Chicago Board of Trade, you can purchase the right to buy 5,000 bushels of wheat. If the price of wheat rises above your fixed price, you can sell your futures contract at a profit.Before we get to the real life example, I must introduce you to the candle chart. In almost every commodities chart you will encounter, the daily, weekly or monthly fluctuations in price will be shown as a candle similar to the one shown. The left-hand horizontal line represents the price of the commodity at the start (“opening”) of the trading day, week or month. The right-hand horizontal line represents the price at the end (“closing”) of the trading day, week or month. The upper perpendicular line represents the highest price (“high”) reached during that trading period. The lower perpendicular line represents the lowest price (“low”) reached.A Commodity Futures Price Chart

Reading Candle Charts
The candle has been around for a while, and for good reason. It is useful, simple, and easy to read.
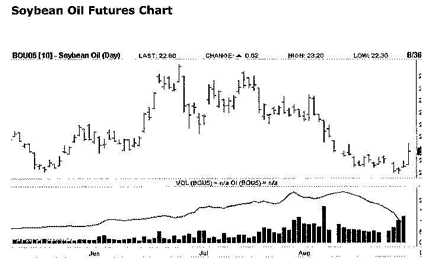
It does have its limitations. A daily chart candle won’t tell you where the price of a commodity went during the course of the trading day, only how high and how low, and what the price was at the open and close of the day. But an hourly candle chart, or a fifteen-minute candle chart, or even a one-minute candle chart will do that. Usually, however, such specificity is unnecessary, and a daily chart suffices for most analysis.Examine the complete daily candle chart of September Soybean Oil futures. I am confident, if you made it through high school math, you will have no trouble understanding the upper part. The horizontal bar shows the time elapsed. The perpendicular bar shows price levels. The chart shows that trading on August 23 opened at 22.60 cents a pound, had a high of 22.69, a low of 22.38, and closed at 22.56. Nobody should have any trouble tracing that on the candle corresponding to August 23.In addition, you can compare the opening, high, low and closing prices of August 23 with those of the days before August 23, and decide based on the pattern they form whether the price is going up, down, or staying stable.But the bottom half of the chart still remains a mystery.
This shows two important figures. The first is a bar graph of the volume of contracts traded.
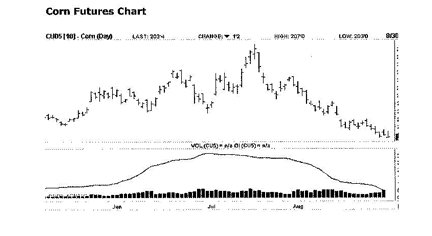
As you can see, 4,386 September Soybean Oil contracts were traded on August 23. What it does not tell you is whether these contracts were new acquisitions by people hoping the price would go up, new short sales by people hoping the price would go down, or close-outs by people exiting the September Soybean Oil market. For that we need to consult the line graph superimposed over the bar graph, which shows how many open interests remain outstanding, or how many people presently have a position, long or short, in September Soybean Oil. At the beginning of August, September Soybean Oil had approximately 16,000 open interests. But as the month grew old, that number declined, until now only about 10,000 remain. This is hardly a surprise, because next month is September, when traders must either take delivery of 60,000 pounds of soybean oil on or before September 14 (the last business day prior to September 15), or close out their contracts. Some companies, such as Kellogg, will take delivery. But the vast majority of contracts will be closed out. As we can see from the dwindling number of open interests, this closing out of contracts has been in progress for some time, and ought to serve as a warning against investing in that particular month of Soybean Oil at this time. Instead, if you want to go into Soybean Oil, you should purchase an October or December contract, which will be slightly more expensive, because the cost of storing the Soybean Oil (the “carryover” charge) is taken into account.Now let’s get to our real-life trading example, a September Corn contract. As the chart below shows, on May 13, 2005, September corn went down to 211.25/bu (two hundred and eleven and a quarter cents per bushel, or $2.11 ¼), a two-year record low. If you were fortunate enough to buy a futures contract on that day at 211.25 for a margin of $588, you would then own the right to purchase 5,000 bushels of corn at a rock bottom price, paying a mere trifle for the privilege. On May 16, 2005, the very next trading day at the Chicago Board of Trade, fear of drought damage caused the price of corn to jump to 214/bu ($2.14 per bushel). Since on May 16 you already possessed the right to buy at 211.25/bu, you also possessed the right to turn around and sell it at 215.5/bu, pocketing a profit of $212.501. Consequently, the value of your futures trading contract has gone up by $212.50, from the $588 you paid, to $800.50. So rather than going through the trouble of getting together $10,562.50 and worrying about how to fit 5,000 bushels of corn into your garage, then finding a buyer and shipping the corn to him in a U-Haul trailer hitched to your SUV, you can simply sell your futures contract and pocket the profits, or $212.50. But if you held onto the September corn contract until July 18, 2005, the price of corn would have reached a high of 263/bu ($2.63 per bushel), and your futures contract would have been worth $3,175.50 for a net profit of $2,587.502 on an initial investment of only $588, or 440% IN JUST 66 DAYS!!!!!! Is leverage awesome or what?
A quarter cent ($0.0025) is the smallest value change that registers on the exchanges for the price of a bushel of corn.
This is called in trader parlance a “tick,” and every tick in the price of corn is worth $12.50 per contract. So in shorthand, since between May 13 and July 18, 2005, the price of corn went from $2.11 ¼ to $2.63, it climbed a total of $0.51 ¾, which comes to 207 ticks, or $2,587.50.Can you see how online trading commodities can make money? Futures trading can leverage a little money to control a lot!More Info...
- Futures Trading Part 1
Futures Trading: Commodities, the Source of All True Wealth - Futures Trading Part 2
Futures trading - Contracts and Other Peoples' Money


