The Bottom of the Bear Market, Spotting Trends, and How You Can Profit from It All

Have we hit market bottom?
I'm going to show you how to do some basic technical analysis using trendlines, and how these lines could indicate that this is the bottom of the current bear market. After I show you my analysis I'm going to tell you what this means for you, and how you can profit from conditions such as these.
The graph below is the 6-month performance of the S&P 500 Index going back to early October, 2007. You may find it helpful to print that out and, using a ruler, draw some of the very basic trendline analysis I'm going to be walking you through. You could just use my own trendlines, but I feel that in the interests of pedagogy drawing your own would be fun and useful.
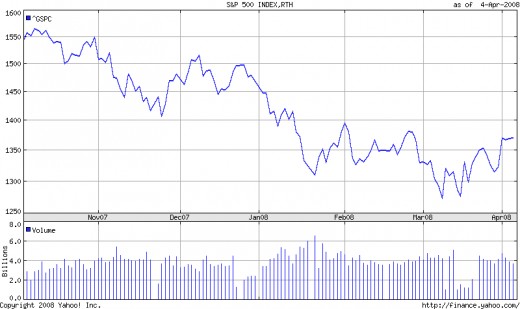
Basically what we see here is the overall market performance, and beneath that you see a series of bars. These bars indicate the Volume, or number of shares exchanging hands on that particular day of trading. Volume is a key component of technical analysis, so I like to have it at the bottom of all my charts.
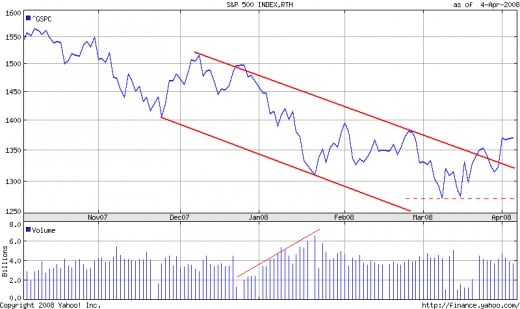
Now if we connect the low points on the downslope, the bottoms of what are known as the troughs, then we can get an idea of the basic trend. This bottom line is what's known as a trendline. We can also draw a line on the highs, or the peaks, and that will provide us with a rough guideline as to where the market fluctuations are going to be during this period. We refer to this top line as a resistance level, since the market will often rally up yet be unable to breach this level. Remember those Volume bars? Notice how they increase as the market sells off. I've gone ahead and drawn them for you on the graph below. I know I don't draw absolutely perfect lines, but market analysis is as much of an art as it is a science.

We can clearly see two troughs in March that both dip down to to about 1275. You can go ahead and draw a horizontal line on the bottom of those, and since it doesn't follow our trend I generally used dashed lines until I get confirmation of a reversal. This horizontal line in March could be what is known as support, meaning that if the market dips down again in April there is a good chance it can bounce off this line.
There are a couple of things that lend support to the notion that this is possibly the bottom of the bear market, at least for now. First of all you'll notice that there's another exhaustion point towards the end of March. Now I know I said these exhaustion points don't always indicate a break in the trend, but in the overall picture this looks like a good sign. I could also use this peak as well as the peak of the previous exhaustion point in late December to re-draw a new resistance level to my trendline but you'll often find it useful to extend old trendlines and wait for confirmation of the bigger picture.
The trough following the March exhaustion point as we approach April does not break, touch, or even approach our support at 1275. In fact, it doesn't even break 1300. Instead it rallies back up and breaks through our resistance level at about 1330. Now let's go ahead and draw in another dotted resistance level to see where this new trend might take us.
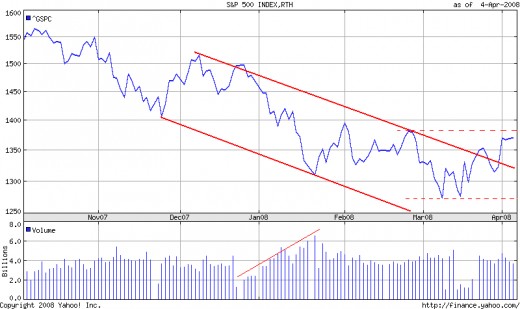
Remember how I said drawing trendlines is an art as well as a science? We could draw all new trendlines for this apparent shift using the new peaks and troughs created in March. This would give us a clear upwards trend, but I generally like to wait for more confirmation first before I go ahead and do that. I can always keep those trendlines in mind, but until then I'm just going to go ahead and draw my new possible support and resistance levels in dotted lines.
The reason that I don't rush to draw new trendlines is that if you look at the overall picture there could be a couple things going on here. This could be temporary sideways momentum, to be followed by another bearish pull to new lows following our original downward trendlines. Or this could be a stabilization, or consolidation, period and the market's going to float on horizontally for a bit, bouncing up and down a little between our dotted lines. Both of these conditions would soon destroy any new upward trendlines we may have drawn.

So where do we go from here?
It's difficult to say where the market will go from here, but from the evidence we can say that this may be a market bottom for now. Markets and stocks tend to test support levels a couple times, three times or more being a very clear indication of a bottom. As you can see our support (bottom dotted line) has been tested twice so far in March. Our resistance (top dotted line) hasn't been tested much, but we'll have to wait for April to show us what's going to happen with that line.
We can look to other indicators. Remember those volume bars? This is where they can come in real handy. From early December through to about the third week of January we can see the volume is really increasing. As the S&P is falling there is a much greater sell-off going on here, hence the volume increase. More people are selling shares in fear of a crash. This sell-off peaks in mid-January with a trough right around the middle of our soon-to-be trading range (between the dotted lines.)
As we go from February to April the volume is pretty much a horizontal line. Since the volume is rather stable going into April it is likely a sign that the market is stabilizing in this new range and will likely bounce up and down for a while before a new up- or downward trend emerges. If we start to see a pick-up in volume in April then something is probably going to change, up or down. My guess is up, and I'll tell you why.
If we use our technical analysis this is a fairly good indication of what we call a reversal. Our downward trend has slowed, stopped, and stabilized. The bottom has been tested twice, and the peaks have broken our resistance twice (first at about 1340, again at around 1330.) But when we combine that with fundamental analysis then we start to see a bigger picture.
Let's talk a little bit about the economy. The Federal Reserve recently cut rates by 0.75%. Rate cuts mean cheaper money for those who want to borrow it - loans to people, businesses, and also to investors who essentially borrow money to buy more shares. In other words a rate cut is often followed by a market rally. While we cannot predict the size of the rally we can often predict that it may happen. The Fed is likely going to slash rates again in mid-April, probably by about 0.50% this time. This could be followed by a market rally.
Another reason: the consumer. There are two key things about us consumers that are very interesting right now. We surprised many analysts last quarter with some better-than-expected retail returns. Analysts have a tendency to low-ball their estimates anyway, but there were some happy surprises. Second thing is tax returns. Despite your political leanings, and we won't get into the budgetary crisis of this move, Bush gave a lot of people in this country a small chunk of change this year. While it isn't much, our country has proven time and time again that we are not savers. Money burns holes in our pockets. If the government gives us even a little we're likely to go out and spend it. If we do, and if we beat analyst estimates for a second quarter, a rally is likely to come.
What this all means is that there are indications of a market bottom. I like to think of market bottoms as bargain bins. Some really excellent companies are having extraordinary clearance sales right now as far as their stock is concerned. A savvy investor accumulates these deals and then rides the upswing. A more conservative investor will wait a little bit to see if this truly is a market bottom and then go back in when all signs point up. Whatever your investment style, don't fret. Recessions have to happen in order for future economic growth to occur. You need the bad days to make the good days good. It's your call as to how you spend the bad days, and being an optimist I like to turn them around... and in market conditions like this that spells P-R-O-F-I-T.


