Basic Technical Analysis – Stocks Trading Basics- Get Free Stock Data from Yahoo Using Excel
New To Stock Trading
If you are new to stock trading, the first thing you will hear of in your stocks trading basics is probably stocks technical analysis. A stock technical analysis is a method of evaluating the strength or weakness of a stock by use of the stock’s market prices, volume and open interest. By evaluating the stock’s weakness or strength, one can then extrapolate and predict the future market trend of the stock. With technical analysis, the intrinsic value of the stock is hardly considered. By use of the historical prices of the stock being analyzed, one can to a certain degree of accuracy determines the future prices of the stock. This is usually done by plotting a chart of historical prices against time and assuming that the market psychology is actually influenced by the market prices.
Stock Technical Analysis
Stock technical analysis using stock charts was popularized by Charles H. Dow who theorized that stocks have measurable trends that are predictable in what became to be known as Dow Theory. A stock chart is usually plotted using the stock closing price on one axis and time on the other axis. Other than the closing price, the high price, low price and opening price can also be plotted against time. The time frame mostly used is the daily prices. Other time frames that are commonly used include minute prices, hourly prices, weekly prices and monthly prices.
Trend is Your Friend
Every stock analyst will usually use an arithmetic scale when analyzing stocks over a short period of less than five years and a logarithmic scale when analyzing stocks over a period of more than 5 years. The main aim of a technical analysis is to establish a trend based on the time frame that you are trading. The assumption is that a trend will continue with the same direction until it tells you otherwise. Investors therefore believe that trend is your friend and therefore they base their trades based on the current trend.
A stock can either follow an uptrend, a downtrend or a sideway trend. An uptrend is usually signified by a series of higher highs and higher lows. A downtrend is usually signified by a series of lower lows and lower highs.
Stock’s Historical Price Data
To do stocks analysis, you will need to have the stock’s historical price data. Today, there are many online sites where you can get that historical data. The best source may be from your stockbroker who may have ready plotted charts for you to download. If you already do not have a brokerage account with a stock broker, then you may not be able to get data information from them. One may need to do some paper trading before deciding to enter into stock trading in which case you will need free historical stock data.
Basic Technical Analysis
There is a good feel when you get raw stock data and you analyze it yourself rather than downloading ready plotted charts. In any case, for you to get a good understanding of the analysis you will definitely have to do the analysis by yourself and once you have a good understanding of Basic Technical Analysis, then you may opt to start using the ready made online charts.
Free Stock Data from Yahoo Finance Using Excel
The aim of this article was to explain how one can get Free Stock Data from Yahoo Finance using Excel. The easiest way is to go to Yahoo Finance Historical Data Webpage and download the data manually. All you need do is the following:
1. Input the Stock symbol of your stock
2. Set date range by inputting start date and end date
3. Input the time range of data - daily, weekly, monthly or dividends.
4. Click get prices
5. And then below the page, click ‘Download to Spreadsheet’.
And there you will have your historical data – open, high, low, close, and volume data, in an excel spreadsheet. With this data in excel, then you can do all kind of technical analysis you may think of.

Books on Basic Technical Analysis
Free Data for Multiple Stocks
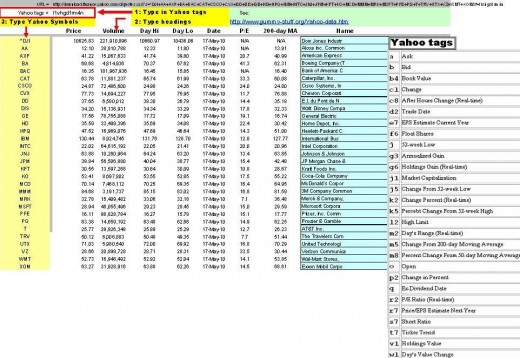
The bad thing with this is that it is tedious since for stock analysis you may need to analyze the stock every day the stock trades. You may also need to analyze multiple stocks and in that case you will need a ready made excel spreadsheet that will automatically download stocks data from yahoo finance free.
To get Free Multiple Stock Data from Yahoo Using Excel, you will need to download either one or both of the following free spreadsheets.
1. Multiple Stock Data from Yahoo Using Excel – current data
2. Multiple Stock Data from Yahoo Using Excel – historical data
The credit to the two free excel spreadsheets goes to Peter Ponzo. Make sure to carefully read instructions in the worksheet named “Explain”.
If you have liked this article, and you would want this page to keep up and improved, you can help by purchasing some great items from Amazon by following Amazon links and widgets on this page. A free way to help would be to link back to this webpage from your web page, blog, or discussion forums.
The Author’s page is designed to help beginners and average readers make some money as an extra income to supplement what they may be earning elsewhere - details of which you can find in My Page, if you will.


