Bollinger Bands

Bollinger bands (often abreviated as “BB”) were developed by John Bollinger during the 1980s. They are a stock price valuation. It is a technical type of analysis tool, which meany that they observe the stock price and tendencies in the stock price rather then the performance of the issuing company. Bollinger bands have three elements, each of these elements can be used separately, however Bollinger bands combines them. The Bollinger bands have three lines elements, these lines are called bands. These three elements are the following:
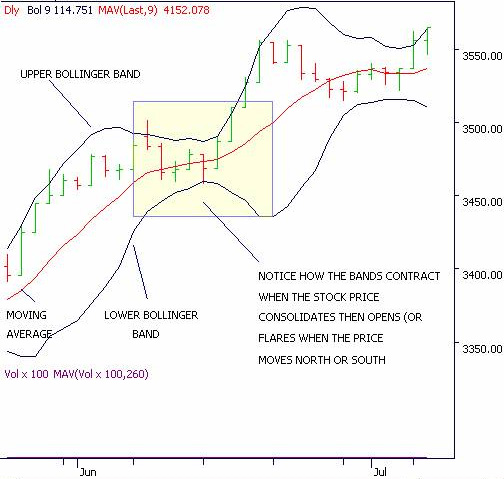
- A band in the middle. This line is the simple moving average of a stock price during a given period of time.
- A lower
band. This band represents the downward standard deviation of the stock price
from the simple moving average (the middle band) at K times in the specific
period of time.
- The upper band. This line is formed the same way as the lower band, however it is the UPWARD standard deviation.
Normally the period of time (denoted as “N”) is 20 (meaning last 20 trading days, which is one month), and “K” times is usually 2 (meaning standard deviation of 2), however both of these can be modified according to the needs and wants of the analyst/investor. Also, the simple moving may be replaced with other types of averages.
Bollinger bands measure the range in which a stock price moved in the given period of time. What this means is that if the candle stick price of the exceeds the upper band (breaks out) than that is a sign that the price of the stock is overpriced. When the term overprice is used, stricktly technicall analysis is meant, not fundamental. Whe the stock price is overvalued, it should be sold. Inversely, when the stock price is lower than the lower band, that means that the stock is undervalued, that is, the stock should be purchased. In other words, Bollinger bands analiste the the past and the future trends. Usually Bollinger bands are used by daytraders. Day traders are speculators, buying and selling the same shares during the same stock exchange trading day. An advantage of Bollinger bands compared to other technical analysis tools is that they can be used on virtually all capital market products, such as currency (FOREX) and options trades. Bond traders can also use Bollinger bands. Analysts and daytraders usually use Bollinger bands in conjuction with other technical analysis tools.
The advantage of Bollinger bands are that they signal trends very well. However Bollinger bands are largely ineffective in case of very volatile securities, as their prices fluctuate widely in a short period of time. Also in case of illiquid securities, they are completely ineffective, as it is vital for Bollinger bands to have lot of data (price changes) in short periods of time and that these changes are frequent and regular. In illiqued periods the bands contract. In volatile markets, the bands widen.