Candlestick patterns as charting tool for stock investment

candlestick as charting tools
Ever wonder how a successful traders earning tons of money out of stock market? If you ever received or read market updates from some broker companies running through some specific stock updates, you will find the term candlestick patterns and analysis using the candlestick patterns formation. So, what is candlestick all about and how it may help you in buying or selling your stock? I’m regular stock trades and had been doing that for over 10 years. I had done quite a number of researches on understanding the whole candlestick charting and how to actually apply them into real trading. I believe sharing this knowledge will be beneficial to some traders, especially for those who would like to indulge into technical analysis type of trading.
What is candlestick?
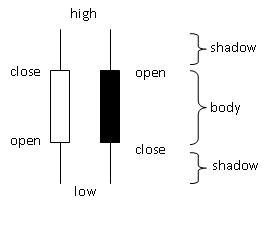
Founded by Japanese rice traders in 16th century and expanded to stock trading by Steve Nison, candlestick patterns have become one of the most accurate tools to identify the reversal as well as price action of stock. To form a candlestick, we will required to have open, close, high and low information as well as comparison of previous bar. Body represents opening and closing of the day price action while shadow representing the high and the low of the day price action. The body color tells you whether the opening price is higher or lower compared to closing price. If the opening is higher, then it will become white color and vice versa. So, by just looking at the candlestick body color, you can already know whether on that day, the price is up or down.
Candlestick Patterns
There are a lot of candlestick patterns primarily to indicate whether it is reversal or continuation. Imagine how to memorize more than 30 types of candlestick patterns for newbie on using candlestick for technical analysis. There are 12 major candlestick patterns that I felt is sufficient for any traders to make sound judgement on predicting the price movement. For this hub, I will only cover on Doji and Hammer. Covering all 12 major candlestick patterns in one hub will be too long for any reader. So, the rest of them will be in my next hub.
Doji
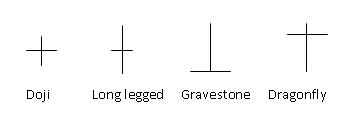
Doji formed when the opening and the closing of the day price is the same or nearly same. In other words, the body will be formed like a horizontal line. When doji appeared, it is indicating that market is indecisive mode. It may potentially indicated bull take over or bear might just jump across the bull. Special caution needs to be taken care of if doji appeared on the upper side of the uptrend stock. There are 4 types of doji variation, which are normal doji, long legged doji, grave stone doji and dragonfly doji.
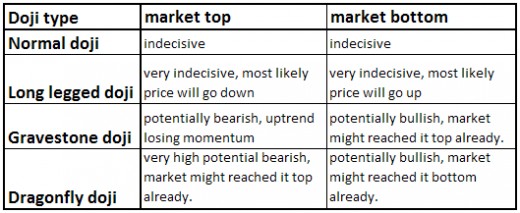
Below I summarized the type of doji and what it means when happened at market top or market bottom.
Hammer
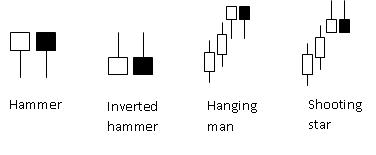
Like doji, hammer also has 4 types of variation, which are hammer, inverted hammer, hanging man and shooting star. The hammer and inverted hammer are type of the bullish reversal pattern candlestick. Hammer has a small body that forms at the upper end and shadow at below the body. As for inverted hammer, it is the reversed of hammer. Both occurred at the bottom of the downtrend. When hammer or inverted hammer observed, it is indicating that potentially the reversal will be happening. The bullish reversal strength of hammer and inverted hammer will increase if they occurred near or at support line. The reversal of hammer and inverted hammer will not take into consideration whether the body is either white or black. The bearish reversal of hammer variation is actually showing the same shape of hammer as well as inverted hammer, but occurred at top of uptrend.
Examples of stock price movement using doji and hammer variation
For example, I’ll be showing 2 stocks listed in NYSE, one which is showing the bearish reversal (Agilent Technologies Inc) while the other one is showing bullish reversal ( AVX Corp) using combination of Doji candlestick pattern variations and also hammer candlestick pattern variations.
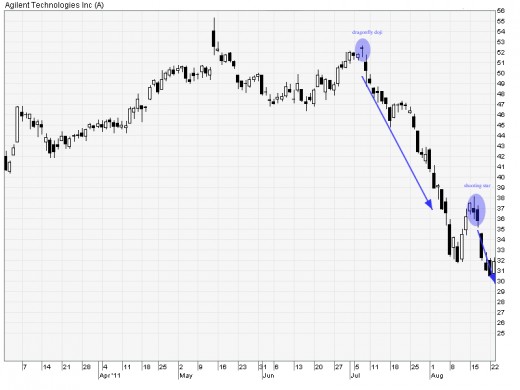
The above chart is showing Agilent Technologies Inc price action from June to Aug 2011. On July 7, we observed that dragonfly doji appeared on the top of uptrend. This should trigger the trader on high potential that bearish reversal will be happening. Right after 7 July, the price plunged from USD52 straight down to USD32 on 10 Aug 2011. The price later on moving up for one week and the form shooting star before resume back the down trend.
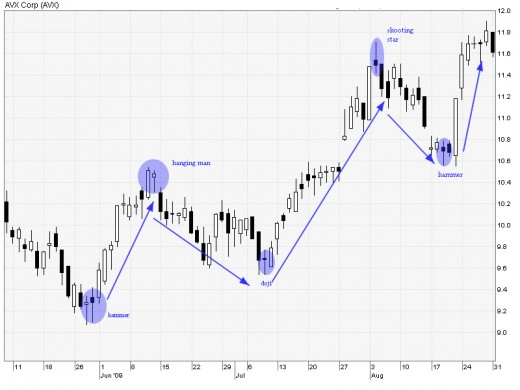
Another example showing combination of hammer variation and also doji variation is AVX Corp for bullish reversal. On 28 and 29 May 2009, 2 hammers observed at the bottom of the downtrend. After that, price started to move up until 12 June where hanging man appeared. As mentioned, hanging man is a bearish reversal candlestick. After hanging man, stock started to move downward until July 10 where we observed a doji appeared. This is the point where the price reversal occurred. Price started to move up from USD9.68 until USD11.49 on 4 Aug where shooting star appeared. Straight after shooting star, bearish reversal occurred.
Summary
From 2 examples above, it is observed that how we can actually utilizing doji variation and hammer variation in order to predict potential price movement. The combination of the variation will give you better understanding on whether the price might potentially moving up or down.
Disclaimer
The content of this hub is purely for educational purpose only and cannot be taken as an advisory service or market prediction. There are a lot of factors impacting whether the stock price will go up or down.
Related

Understanding the P/E Ratio: A Guide for Smart Investors
")
Commercial Law on the Sale and Purchase of Businesses in Papua New Guinea (Second Part)

Cards Against Humanity and Expansion Packs - One, Two, Three, and Four

Validity of Call and Put Options in Private Equity/Shareholding Deals

My Best Tips for Investing in Stocks and Shares in 2025


