Fixed Deposit vs Stocks

Introduction
All risk adverse investor would like to gain maximum return from the risk their take. Shall investor invest their hard earn money in fixed deposit (risk free rate) or stock market?

Comparison between Fixed Deposit vs Stock Market
Lets explore these options, Malaysia Depository Rate and Malaysia Stock index are use for these comparison. Table below shows the Malaysia Deposit Rate and Malaysia Stock Index from 1980 to 2014. The Malaysia Deposit rate is data obtain from The World Bank and the Malaysia Stock Index values are the closing price on 31 December each year, estimated from Trading Economic KLCI chart.
Malaysia Depository Rate vs Malaysia Stock Index
Year
| Malaysia Deposit (%)
| Malaysia Stock Index
| Percentage Change in Stock Index(%)
|
|---|---|---|---|
1979
| 205
| ||
1980
| 6.2
| 360
| 75.61
|
1981
| 9.7
| 370
| 2.78
|
1982
| 9.8
| 290
| -21.62
|
1983
| 8
| 400
| 37.93
|
1984
| 9.5
| 305
| -23.75
|
1985
| 8.8
| 220
| -27.87
|
1986
| 7.1
| 250
| 13.64
|
1987
| 3
| 260
| 4.00
|
1988
| 3.3
| 355
| 36.54
|
1989
| 4.6
| 560
| 57.75
|
1990
| 5.7
| 510
| -8.93
|
1991
| 7.1
| 560
| 9.80
|
1992
| 7.9
| 645
| 15.18
|
1993
| 7
| 1250
| 93.80
|
1994
| 4.9
| 990
| -20.80
|
1995
| 5.9
| 995
| 0.51
|
1996
| 7.1
| 1240
| 24.62
|
1997
| 7.8
| 600
| -51.61
|
1998
| 8.5
| 600
| 0.00
|
1999
| 4.1
| 810
| 35.00
|
2000
| 3.4
| 675
| -16.67
|
2001
| 3.4
| 700
| 3.70
|
2002
| 3.2
| 650
| -7.14
|
2003
| 3.1
| 790
| 21.54
|
2004
| 3
| 910
| 15.19
|
2005
| 3
| 900
| -1.10
|
2006
| 3.1
| 1090
| 21.11
|
2007
| 3.2
| 1430
| 31.19
|
2008
| 3.1
| 890
| -37.76
|
2009
| 2.1
| 1280
| 43.82
|
2010
| 2.5
| 1520
| 18.75
|
2011
| 2.9
| 1540
| 1.32
|
2012
| 3
| 1690
| 9.74
|
2013
| 3
| 1860
| 10.06
|
2014
| 3
| 1760
| -5.38
|
Geometrical Mean Return
Malaysia Deposit (%)
| Malaysia Stock Index (%)
| |
|---|---|---|
Geometrical Mean (1980-2014)
| 5.14
| 6.34
|
Geometrical Mean (1980-1989)
| 6.97
| 10.57
|
Geometrical Mean (1990-1999)
| 6.51
| 3.76
|
Geometrical Mean (2000-2009)
| 3.31
| 4.68
|
Geometrical Mean (2010-2014)
| 2.88
| 6.58
|
From the data above, overall the Malaysia stock index beat the bank depositary rate by 1.2 %. From the ten years geometrical mean only from year 1990 – 1999 where the market did not beat the depositary rate. The period 1990 – 1999 is the range of the years where Asia financial crisis was in (1997). During 1997, the Malaysia stock market fall a dramatic – 51.61 the worst fall in Malaysia stock history.
Even with the worst decade, investor still able to have 3.76 % return if their trade the exchange traded fund (ETF) that track the index from 1990 – 1999 while the worst return for a depositary rate is 3.31% which is from 2000 – 2009. Please bear in mind the stock index does not included any dividend pay by the companies hence the return from the ETF might be higher that what it is stated.

Compounded Return
Now let’s look at what is the compounded return if an investor invested RM 10,000 in a fixed deposit compared to a stock from time period 1980-2014, 1990-2014, 2000-2014.
Compounded Return for Fixed Deposit vs Stock (35 years, 25 years and 15 years)
Year
| Invested in 1980
| Invested in 1980
| Invested in 1990
| Invested in 1990
| Invested in 2000
| Invested in 2000
|
|---|---|---|---|---|---|---|
Fixed Deposit (RM)
| Stock (RM)
| Fixed Deposit (RM)
| Stock (RM)
| Fixed Deposit (RM)
| Stock (RM)
| |
1980
| 10,620.00
| 17,560.98
| NA
| NA
| NA
| NA
|
1981
| 11,650.14
| 18,048.78
| NA
| NA
| NA
| NA
|
1982
| 12,791.85
| 14,146.34
| NA
| NA
| NA
| NA
|
1983
| 13,815.20
| 19,512.20
| NA
| NA
| NA
| NA
|
1984
| 15,127.65
| 14,878.05
| NA
| NA
| NA
| NA
|
1985
| 16,458.88
| 10,731.71
| NA
| NA
| NA
| NA
|
1986
| 17,627.46
| 12,195.12
| NA
| NA
| NA
| NA
|
1987
| 18,156.28
| 12,682.93
| NA
| NA
| NA
| NA
|
1988
| 18,755.44
| 17,317.07
| NA
| NA
| NA
| NA
|
1989
| 19,618.19
| 27,317.07
| NA
| NA
| NA
| NA
|
1990
| 20,736.43
| 24,878.05
| 10,570.00
| 9,107.14
| NA
| NA
|
1991
| 22,208.71
| 27,317.07
| 11,320.47
| 10,000.00
| NA
| NA
|
1992
| 23,963.20
| 31,463.41
| 12,214.79
| 11,517.86
| NA
| NA
|
1993
| 25,640.63
| 60,975.61
| 13,069.82
| 22,321.43
| NA
| NA
|
1994
| 26,897.02
| 48,292.68
| 13,710.24
| 17,678.57
| NA
| NA
|
1995
| 28,483.94
| 48,536.59
| 14,519.15
| 17,767.86
| NA
| NA
|
1996
| 30,506.30
| 60,487.80
| 15,550.01
| 22,142.86
| NA
| NA
|
1997
| 32,885.79
| 29,268.29
| 16,762.91
| 10,714.29
| NA
| NA
|
1998
| 35,681.09
| 29,268.29
| 18,187.76
| 10,714.29
| NA
| NA
|
1999
| 37,144.01
| 39,512.20
| 18,933.45
| 14,464.29
| NA
| NA
|
2000
| 38,406.91
| 32,926.83
| 19,577.19
| 12,053.57
| 10,340.00
| 8,333.33
|
2001
| 39,712.74
| 34,146.34
| 20,242.81
| 12,500.00
| 10,691.56
| 8,641.98
|
2002
| 40,983.55
| 31,707.32
| 20,890.59
| 11,607.14
| 11,033.69
| 8,024.69
|
2003
| 42,254.04
| 38,536.59
| 21,538.19
| 14,107.14
| 11,375.73
| 9,753.09
|
2004
| 43,521.66
| 44,390.24
| 22,184.34
| 16,250.00
| 11,717.01
| 11,234.57
|
2005
| 44,827.31
| 43,902.44
| 22,849.87
| 16,071.43
| 12,068.52
| 11,111.11
|
2006
| 46,216.96
| 53,170.73
| 23,558.22
| 19,464.29
| 12,442.64
| 13,456.79
|
2007
| 47,695.90
| 69,756.10
| 24,312.08
| 25,535.71
| 12,840.81
| 17,654.32
|
2008
| 49,174.47
| 43,414.63
| 25,065.75
| 15,892.86
| 13,238.87
| 10,987.65
|
2009
| 50,207.14
| 62,439.02
| 25,592.13
| 22,857.14
| 13,516.89
| 15,802.47
|
2010
| 51,462.31
| 74,146.34
| 26,231.94
| 27,142.86
| 13,854.81
| 18,765.43
|
2011
| 52,954.72
| 75,121.95
| 26,992.66
| 27,500.00
| 14,256.60
| 19,012.35
|
2012
| 54,543.36
| 82,439.02
| 27,802.44
| 30,178.57
| 14,684.30
| 20,864.20
|
2013
| 56,179.66
| 90,731.71
| 28,636.52
| 33,214.29
| 15,124.82
| 22,962.96
|
2014
| 57,865.05
| 85,853.66
| 29,495.61
| 31,428.57
| 15,578.57
| 21,728.40
|
Gain (%)
| 578.65
| 858.54
| 294.96
| 314.29
| 155.79
| 217.28
|
The above table showed that, either an investor invested RM 10,000 during 1980, 1990, or 2000. The stock market outperformed the fixed deposit even without taking in account the dividend pay by the companies. Besides that, the longer the investment period the higher the return provided that all money gain from the investments is invested back to the stock index or fixed deposit.
Stock Market (Roller Coaster Ride) vs Fixed Deposit (Smooth Car Trip)
Invested in stock market is like in the roller coaster ride moving up and down and it is unpredictable what is going to happen next. While put the money in fixed deposit is like having a smooth car trip, the journey is almost predictable.
When invested in stock market, an investor have to hold long term (a few years) to fell the excitement just like having on a roller coaster ride. When someone jump off the roller coaster half way they most probably will injured themselves or even killed themselves. That same go to invested in stock market, if an investor does not have the patient to hold on a up and down in the stock market he/she would most likely loss money.
As for fixed deposit, we just need to hold until the term end usually less than a year. Fixed deposit interest rate does not varies as often as stock market. Hence it is consider as a smooth road trip where we only meet some road bump or pothole one in a while. There is not much excited in fixed deposit, just like a smooth road trip along the highway we only see trees. The excitement only come to the end where the term is end (we reached our destination).
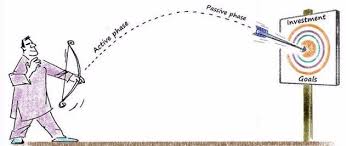
Type of Investment by Ages
Just like a roller coaster ride, as you getting older (> 50 year old) you are not recommended to take the ride. Same go to stock market, young individual shall learn how to invested actively. I personally recommend value investing because by taking some of the times to study a company and only buy an undervalue stock your have reduced the risk, just like having a seat belt buckled up just before the roller coaster ride. For Malaysia investor who wish to do value investing and do not know where to find the stock data, you can go to my previous Hubpage ( Tips for Bursa Malaysia Investor ). If you are not confident to pick a stock yet, you can always invest in exchange traded fund (ETF) which trade the market passively while learning to invest by yourself. Always try to pick your own stock and don't simply depend on others people advise. You are the one who is supposed to control your money not the others people. Take a small steps at a time (trade RM 5000 per transaction) and don't be to hurry, the tortoise can beat the rabbit.
As for older investor, you can take a smoother ride as your always take longer time to recover (no more active income) so try not to fall. A smoother road trip does not mean cannot invest in stock market, I would recommend dividend blue chip stock. The blue chip stocks usually are mature company and has lesser risk to fail. They usually paid high dividend because they are mature and no where to invest their earning. Besides that, older investor can try fixed income ETF which only invest in high rating bond (lower default risk bond).
Conclusion
In conclusion long term investment (> 10 years) in stock is better than putting the money in fixed deposit. However a risk adverse investor will always mixed risk free investment (fixed deposit) with riskier investment (Stock) and balance between those two.
Young investor who have active income and long time horizon can invest more on stock market less in fixed deposit. As they grow older, their portfolio shall change through the risk free asset as the time horizon is reduced. When retires, an investor shall invest almost most of their fund in risk free asset.


