Forex Trading Strategies: Multiple Stochastics

Currency trading may seem simple and easy, in reality is one of the hardest and more stressful jobs in the world. At first glance one can see price fluctuates in only two directions, up and down. Moreover, there are times when price follows a trend, and other times when a currency pair settles to consolidate in a range.
The majority of novice traders have a tendency to buy and sell randomly, sometimes this approach works, the first trades can be winning ones but over time emotional factors like greed and fear take over and traders can go into a losing streak.
Understand Indicators
Major brokers have learning communities or offer tutorials which help beginners to get accustomed with the psychology of the markets and with the application of indicators, oscillators, moving averages and fibonacci retracements to their trading process.
But do these tutorials really explain how an indicator or oscillator should be read and understood?
According to my experience the answer is simply is a big NO. Beginners and even intermediate traders who gained profits with a considerable presence of luck may tend to make decisions based on only one or two timeframes. This kind of approach usually leads to premature or badly timed trades.
Which one to choose? Stochastics or RSI? Oscillators or Indicators?
The answer depends on how these tools display their calculated value based on actual and historical price. In the end, big differences aren't as important as interpretation of the choosen indicator. We will examine how trading can be profitable and safe using Stochastic Oscillators.
Pros and Cons of Stochastics
Pros
- Easy to interpret the basics,
- Easily settable,
- Fairly accurate signals,
- Highly detectable price divergences.
Cons
- Often gives misunderstanding signals,
- A great part of literature on the web is misguiding.
What is Stochastic Oscillator?
Stochastic oscillator (also known as Stochastics) is a momentum indicator used mainly for trading of securities. It was developed by George Lane in the late 1950s. It is extensively used in currency trading for it's mostly accurate signals.
How it is calculated?
Stochastics are calculated based on recent highs and lows of price on a certain timeframe. Its main function is to predict price changes or turning points based on recent price close or high/low ranges.
%K = 100 * (Price-L5) / (H5-L5)
%D = 100 * H3 / L3
Where
Price refers to the last closing price
L5 or L3 is the lowest price determined based on n periods. In this case the 5 and 3 numbered L values may show lows for the past 3 and 5 hours.
H5 or H3 is the higest price determined based on n periods. In this case the 5 and 3 numbered H values may show highs for the past 3 and 5 hours.
%D refers to a 3-period simple moving average of K%.
Stochastics Trading Rules
SELL: K% and D% lines are greater than or equal to 80 and cross each other.
BUY: K% and D% lines are smaller than or equal to 20 and cross each other.


How to interpret Stochastic Oscillator?
Now, that we've gone through calculations, let's see stochastics in action. As I mentioned before, this kind of oscillator constantly looks for possible price ranges and their cyclical changes. Usually, when K% and D% cross each other - whether on top or bottom - a selling or buying signal has to be considered.
There are times when market doesn't care.
Novice traders, beginners and even experienced traders may end up in a trap believing indicators and other statistical data come first. Indeed, the reason behind this is simple as hell, fundamentals.
Economic news such as changes in bank lending rate, surprising macroeconomic data like an unwanted rise of inflation rate may cause long-lasting trends.
How stochastics react to trends?
It is worth mentioning that Stochastic Oscillator is NOT a trend indicator. However, techniques to detect a birth of a trend or conversely a trendbreak do exist.

Tell Us Your Opinion!
How Useful Divergences Are?
Stochastic Divergence
This type of phenomena is considered an ace in the hole. A divergence is when a price is rising or falling but price change over time shows some struggle like market indecision. If we consider detecting divergences with naked eyes, we can see, that even candlesticks can give good signals, however not all traders have good eyes and this is totally acceptable. With the aid of stochastic divergences, one can predict a definitive trendbreak, a minor correction of an uptrend or downtrend or false range breakouts.
How can divergence be understood in terms of statistics?
Remember the calculation? Stochastics measures price range over a determined period of time. Hence this definition, a trend break with a stochastic divergence may be viewed as a last opportunity of buying or selling securities before a potential economic news would happen. These are moments when volatility increases and taking a bullish trend as an example, while sellers are more and more entering the game but confidence is still premature, buyers do their last purchases before hitting their last target and taking their profits.
As we can see in the picture, the oscillator is giving its first sell signal. Then bears are starting to make corrections, but their force is still weak, and stochastics pauses near 50 level. Later on the trend resumes but traders suspect the trend will suffer a bigger correction so the oscillator continues its path toward the oversold area.
As price makes higher highs faster than stochastics, with time being too scarce to push %K and %D lines higher, stochastics gives a signal that a new high is forming, and price will go lower.
Trading with Multiple Timeframes
Indicators are used best if their values are compared on different timeframes. In the case of Stochastic oscillator, the chances of catching a good trade are high.
Understanding this kind of approach carries a great need for attention, accuracy and cautiousness. Whenever we see three forming divergences on three - typically intraday - timeframes like M15, M30 and H1, it is worth paying attention for a possible shift in price direction. Of course this approach is not an indicator of a previously undiscovered holy grail, however this attitude will grant a different way of seeing and interpreting this fabulous tool.
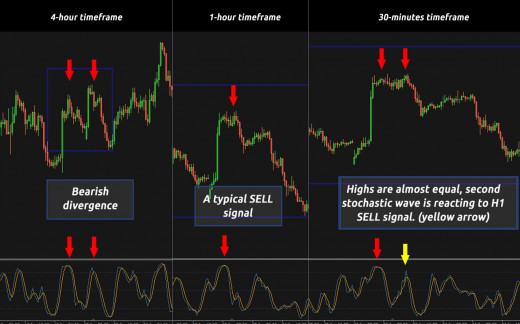
Multiple Timeframe Analysis
In the picture above, we can see, that whenever a divergence appears on a major timeframe, technical analysis of other scenarios becomes easier. In this case, H4 is showing a bearish divergence, to confirm it, we take a look to smaller charts like H1 and M30. H1 is giving a clear sell signal, at the same time M30 is also giving signals of a possible price reversal.

Divergence confirmation on multiple timeframes
A divergence can be a really good signal for entering a trade. But there is a pitfall a lot of traders fall into.
THE MORE DIVERGENCE WE FIND, THE MORE WE ARE likely to open a winner trade
In the example above, the divergence was spotted on four-hour timeframe. If we want to ensure our trade will encounter the lowest risk as possible, it is advisable to check for other signals on lower timeframes.
One divergence leads to another
In the picture on the right, we can see, that even if a higher high has formed, the real correction is yet to come. To understand this, let's go step by step and examine how a possible correction can be caught and therefore be profitable:
- The one-hour timeframe is signaling multiple bearish divergences.
- The four-hour timeframe is also signaling a forming divergence, but opening a trade would be a bad idea.
- Instead, waiting for %K and %D lines to meet, in other words waiting for stochastics to mature on H4 timeframe is the safest solution. (see green arrows)


