General Terminologies

General Terminologies
Like most other professions, various terminologies exist in the area of trade and investment that define industry-specific behaviours and products. Here, we will discuss some of the common terminologies that you may come across in the world of trading and investment.
Bulls & Bears
You will hear the commonly used terms ‘bulls’ and ‘bears’ or ‘bullish’ and ‘bearish’ in trading. These terms can either describe the specific attitudes or outlook of an individual, or they can describe the overall market condition. For example, if an investor feels confident about a stock, their trading behaviour will lean towards charging ahead and buying many stocks. Therefore, the investor could be described as having a ‘bullish outlook’ and he/she would be considered a ‘bull’. However, if an investor has a pessimistic outlook or believes that the stocks will fall (preferring to sell and hibernate) they would be considered as having a ‘bearish outlook’, and he/she would be considered a ‘bear’. Similarly, a bull market describes a rising market trend, growing stocks and a growing economy. A bear market refers to a declining market trend, falling stocks, and a slowing economy.
Remember: Bulls thrust their horns UP, bears thrust their claws DOWN.

Bid & Ask
Due to the buy, sell and auction characteristics of a stock market, ‘bid’ and ‘ask’ prices refer to the prices you can buy and sell stocks at a given point in time. A bid price is the highest price a buyer is willing to pay for a security. An ask price is the lowest price a seller is willing to sell the security for. The value difference between the two is called the bid-ask spread. The difference between the bid and asked prices, or the spread, is a key indicator of theliquidity of the asset. Generally speaking, the smaller the spread, the better the liquidity.
Index
An index is a portfolio of stocks and their changing market performance, which statistically represents a portion of the overall market. Because it would be too complicated and time-consuming to measure the performance of every single trade for every company, the use of an index effectively compares the performance of company’s stocks and an entire market or segment by using a smaller sample of the market to represent the whole. Changing prices in the index are proportional to the change in stocks in the index, as the index mimics the whole market of those particular stocks.
There are many indexes around the world, each comprising of different companies in various industries. One of the most well-known indexes used in the US is the Dow Jones Industrial Average (DJIA), which contains 30 of the largest companies in the US. Another well-known index is the Standard & Poor 500 (S&P), which tracks the entire US market through it’s 500 largest public firms. The Hang Seng Index (HSI) monitors 50 companies that represent 58% of the capitals in the Hong Kong Stock Exchange.
Other well-known indexes include:
- Nasdaq - NASDAQ Composite (IXIC)
- FTSE 100 - Financial Times Stock Exchange (FTSE)
- S&P/ASX 200 - Australia’s Leading Share Market Index (AXJO)
- Nikkei 225 - Nikkei 225 (N225)
- China A50 - FTSE China A50 (FTXIN9)

Blue-Chips
Blue-Chips are shares of large, publicly recognized, well-established and financially sound companies with an impressive record of earnings and dividends. They are known to be reliable and stable in terms of company growth. Examples of Blue-Chip corporations include IBM, Walmart, Coca-Cola and Procter & Gamble Co.
Long/Short
A ‘long’ or a long position describes the buying of a security with an expectation for the price to continue to rise. When an investor has a long position investment, he/she has purchased the shares and fully owns the securities.
A ‘short’ or short position describes the selling of a security with the expectation for the price to continue to fall. Contrary to a long position investment, a short position investment is one where the investor does not actually own the shares they sold, but has borrowed them (often from a brokerage firm). Because the investor expects the shares to fall in value, he/she would sell the borrowed shares at a certain price (expecting it to fall) making money, then buy the shares back at a lower price (still making a profit since the price has decreased). Then at settlement, the investor would return and pay back the shares to the brokerage firm. The key difference between a long position and a short position is the investor’s expectation of what will happen to a security (whether it will increase in price or decrease in price).
Take Profit/Short Covering
Taking profit means exactly what it seems, you obtain profit by selling your current position on shares. However, this assumes that you have previously taken a long position (where the stocks previously purchased have since increased in value from purchase price), and you are now in a position to sell and make money. Taking profit happens when you sell securities from a long position and keep the profit.
Short covering is also a way of making profit, but by shorting a share. The process involves borrowing securities (expecting the price to decrease), selling them at a certain price, buying them back after they have fallen in value, and returning the shares to the stock broker. Short-covering refers to buying back the securities at settlement.
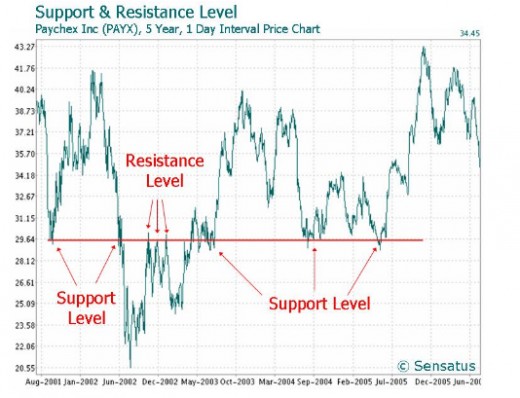
Resistance and Support
The resistance and support levels are technical terms which describe the price levels on charts at any given time. On a chart, the levels act as barriers which prevent the value of an asset from moving higher or lower beyond certain points. Using a short explanation, the resistance levels in a stock chart are the pressure areas which block the value of a stock from rising above that level. For example, you may notice a stock falling and rising to the maximum value of $69 for the last 4 months, but never being able to rise above $69. This would be called the resistance level. Instead, the support level is the price level that acts as a baseline by preventing the price of an asset from being pushed further downward. In general, resistance levels acts as a barrier and prevents prices to increase; whereas support levels prevent prices to decrease beyond the barrier.
Fully understanding support and resistance levels and their implications on profit and loss require analysis of trend-lines. Being able to correctly interpret the levels of support and resistance coincides with knowing when the right time is to profit-take, and when to enter a short position. We will cover this topic more in-depth in other articles.
Stock Exchange
A Stock Exchange is a physical location where stocks are traded. Your transactions are executed at the Stock Exchanges through the licensed broker.

The first Stock Exchange, the Amsterdam Stock Exchange, was established in 1602. It is considered the oldest “modern” securities market in the world.