How To Interpret Stochastics Technical Stock Indicator

If you are an active stock market participant who executes frequent daily or weekly transactions, you've probably heard of, or, are familiar with "Stochastics", an extremely popular equity and index technical indicator. Hailed by many financial industry professionals, market participants, and novices alike, as a prime prognostication tool. Is it a lagging indicator? One that conveniently displays results after the fact, or, a consistently accurate and reliable predictor of the future direction of an individual security or overall market index such as the Dow Jones? In my opinion, even though some experts will proclaim the infallibility of such "Readings" and "Miraculous Nostradamus Like Interpretations", I do, and always will, adhere to my personal beliefs which are based predominantly on in depth textbook study and personal experience. Lessons learned from both inside the "Broker Dealer Realm" of investments and traditional financial institutions such as banks. In addition, I have attained a substantial mental file folder of information on the subject and will also share my "Outside Looking In" perspective which is the culmination of several years of participating in a personal stock trading/investing endeavor. The following article was conceived and produced by drawing generously upon the afore-mentioned proverbial "Well" of first hand knowledge and experience. I sincerely hope you find the overall experience, including the customized images contained within, interesting, enlightening, educational, and of course informative.

"When investing in or actively trading securities, there are unquestionably pearls of proverbial wisdom which can be ascertained by interpreting and evaluating stock technical analysis tools such as "Stochastics" to the best of your ability. However, despite the somewhat over exuberant use in real time practice by the masses, I find the "Infallibility Factor" to be highly questionable at best, just like all other mystical and or fundamentally flawed indicators and or charting systems. The primary focus of this entry is to teach the stock market participant by providing a basic introduction to slow "Stochastics". A solid starting point from which the novice and intermediate level investor can build upon" -
Within the core of this article, a basic introduction to "Slow Stochastics" will be provided for the novice and intermediate level investor, and who knows, even though it was designed primarily for the non-expert who is interested in building a fundamental foundation of knowledge, maybe even the consummate pro might take away a few morsels of wisdom after reading the page in its entirety. A basic understanding of how to read, interpret, and apply this universally acclaimed stock market indicator or "Predictor", will be the main focus. If you ask any professional, I'm confident he/she would certainly not recommend applying this or any other prognosticating technique, analysis tool, or chart interpretation method as a "Stand Alone" strategy for long term equity investment or short term, high risk trading, and it is certainly not advisable for an individual to rely solely on one indicator, especially the beginner. The fact is, despite claims to the contrary, even when "Stochastics" is combined with a virtual myriad of other complimentary oscillators, predictors, or technical analysis methods, the ultimate goal of attempting to gain a significant trading advantage or even workable slight edge, is only intermittently attainable at best. All the due diligence in the world is still no substitute for good old fashioned luck, especially for active short term equity traders. Always keep this in mind and try to exercise prudence by consulting a professional financial person prior to investing, especially if the activity involves a strategy which you are unfamiliar with. Recommendations or specific strategies will not be offered in this article - The following tutorial is offered exclusively as a theoretical learning module -


- WHAT IS STOCHASTICS ?
Stochastics falls within the category of stock and or stock market "Technical Analysis" and is considered by the majority to be a valuable prognostication tool that can for some users, predict and signal optimum "Buy" (Oversold) and "Sell" (Overbought) conditions, i.e. short term or fleeting windows of opportunity for investors to purchase securities at a discount and sell at a premium. Depending upon the method of interpretation and other secondary or tertiary contaminating factors, which are purely subjective at best, Stochastics can reveal a lagging or leading indicator relative to the underlying equity price. Essentially, Stochastics is a perpetually rolling oscillator in constant motion which reflects overall market activity at a given point in time. Some Wall Street Professionals extend the virtual boundaries of explanation, some valid and others open to justified scrutiny, however, in this article, the direct, simplified, easily comprehensible version will be presented in an effort to mitigate the confusion factor.
In brief, there are two different "Living" or "Rolling" lines that constantly move and adjust position in response to related trading activity. From the opening bell, until a final transaction is consummated, the two married or divorced Stochastics lines will perform together in undulating serpent like fashion and migrate toward a certain direction based on several influential factors which include the total number of shares traded, and latest bid/ask price of the corresponding stock or index. Please see the examples below which illustrate "Overbought" and "Oversold" conditions -


- HOW MAINSTREAM INVESTORS INTERPRET & READ STOCHASTICS
Stochastics consists of two married lines, one is typically red or light colored, and the other black or dark colored. When the red or light colored line converges upward and drives straight through or crosses the black or dark colored line, regardless of placement on the graph, typically, this is interpreted as a potential negative for future pricing and a discount might soon be in the offing, or possibly even a more prolonged intermediate to longer term momentum reversal. The discount size and duration of the potential price correction depends upon several factors including the chart time frame. A one day chart build would typically indicate a shorter term correction and smaller discount in price, in contrast, a one year build could be a pre-cursor to a longer term reaction and significantly deeper price discount.
|
|---|
At the opposite end of the spectrum, when the red or light colored line drives downward through the black or dark line from above, typically, this action is considered a bullish signal and indicates a potential premium in stock or index pricing in the future. Always remember, the duration and premium amount depends upon the time frame of the oscillator. - Examples & Illustrations Below -
|
|---|
- OVERBOUGHT
- The opposite of "Oversold". An overbought signal occurs when the light line penetrates through or "Converges" from underneath the dark line when both are positioned above the 80% threshold at the top of the chart as illustrated below. Traditionally, this indicates a bearish or "Sell" signal for the active day trader. Also notice how Stochastics & the price chart move in tandem, one following the other in almost perfect harmony.
"Overbought" Price Chart & Stochastics
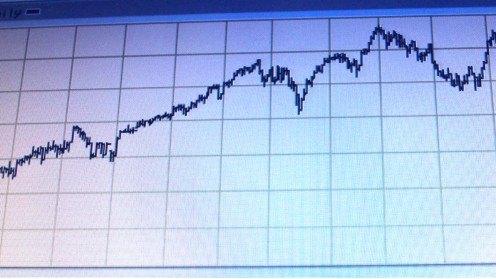
Stochastics

- OVERSOLD
- The opposite of "Overbought". A signal that all investors especially short term for profit traders, are always anticipating so shares can potentially be purchased at what would be considered discounted prices. A bargain basement sale at the local department store so to speak. If time was not of the essence and you could afford to wait an extra week to see if that extravagant seashell pearl colored dress or European cut Italian silk suit would get marked down from retail, would it be worth the shopping spree postponement? Perhaps for some consumers the answer would be yes, and for others on a more rigid financial or budgetary schedule, maybe it would not be a deciding factor. However, when trading stocks for a living, this brief interlude or daylight period as you wait patiently for technical indicators such as Stochastics to flash the trading green light, just might turn out to be the defining difference between paying discount verses premium prices when buying stocks or indices. A critical factor in determining final trade outcomes and attempting to maintain a profitable venture.
- In Brief, the "Stochastics" oscillator signals a potential "Oversold" condition when the red or light colored line crosses through or "Converges" on the black or dark line at a downward angle from above. This action must occur below the 20% threshold at the bottom of the chart. As you can see in the "Oversold" example, the red line is engaging and about to cross the blue line from above which is typically interpreted as a bullish sign.
"Oversold" Price Chart & Stochastics
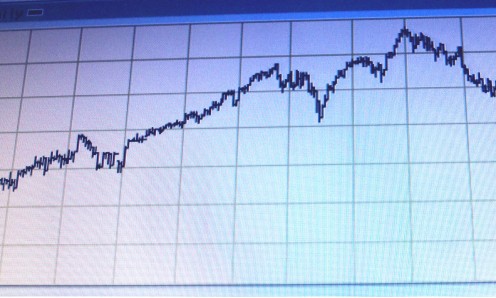
Stochastics

About the Author-
- Alternative Prime is a former Personal Finance Professional - Broker - Life Agent - Series 7& 63 Registered Representative & NASD Member Licensed in 5 States - Stock & Options Researcher/Consultant/Trader/Investor - Contract Quality Check Supervisor - Regional Manager/Trainer and Formally Educated in a Multitude of Subjects Including Business Law Aspects -

<> THANKS FOR VISITING <>
|
|---|
- "Read & Experience" more literary and original visual works by this highly acclaimed author / publisher - Click "Alternative Prime" next to avatar at top of page -
|
|---|

Alternative Prime is a highly respected expert in the field of financial markets who has attained premium status by acquiring and utilizing a virtual wealth of invaluable hands on experience in several divergent subjects including the Stock Market, Banking, Business Development, Corporate Training & Educating, Quality Assurance - Stellar credentials which have paved the way toward fostering cherished long term working relationships with several high profile celebrity clients in the Beverly Hills Ca area and cultivating stimulating social interaction with innumerable readers and acquaintances domiciled throughout the world <>
|
|---|
NOTE to Visitors - The "Links" listed below within the "Discover More Hubs" segment are randomly selected and placed by HubPages, not the author of this specific article - Alternative Prime does not necessarily recommend or endorse the articles nor guarantee quality of the content contained therein -
|
|---|


 System for Timing the Stock Market")

