How to Buy Shares – Moving Average Convergence Divergence – MACD
Starting Buying Shares
If you are starting in buying shares then there are a few technical analysis indicators that you will need to learn so that you can do it successfully. It is true you can start by looking for great IPOs and wait for the price of the IPO to shoot to the roof. But then, the share or the stock or your investment will start dropping in price to below where you bought it. This will happen when you are still hoping that it will soon go back to the roof again. To prevent this from happening to you, you will need a few technical indicators to warn you that your shares’ prices have reached the top and are now beginning to drop in price. One such indicator is the Moving Average Convergence Divergence – MACD.
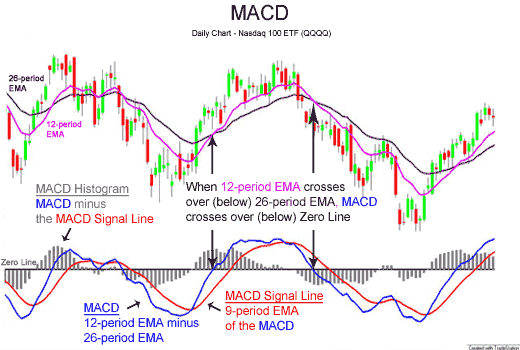
The Moving Average Convergence Divergence – MACD was created by Gerald Appel in the 1960s. MACD shows the difference between a fast and slow exponential moving average (EMA) of closing prices - but you can still just use plain moving averages.
Moving Average Convergence Divergence – MACD
Define:
1. The Slow moving average = 26 days exponential moving average
2. Fast moving average = 12 days exponential moving average
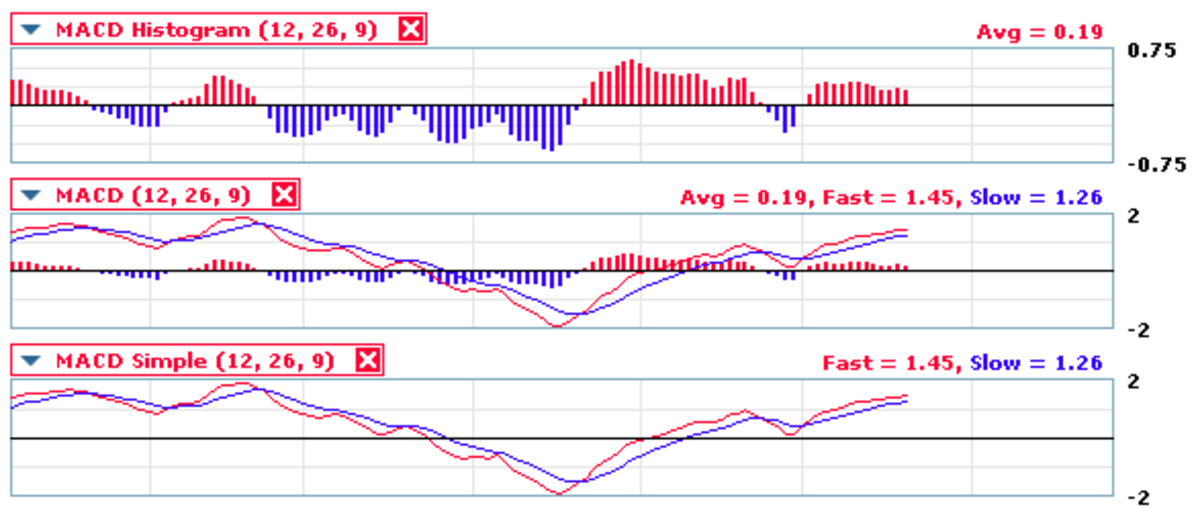
3. Signal line = 9 day exponential moving average of the difference between fast moving average and slow moving average.
4. You can change the periods of your moving averages depending on your discretion.
Trades:
1. Sell or Short the stock when MACD crosses to below the signal line.
2. Buy or Go long the stock when MACD crosses to above the signal line.
Important:
1. The maximum divergence is proportionate to the volatility of the stock. Study the past history of the stock’s maximum divergence to determine reasonable large swings (crests and troughs). Trade only if the divergence has formed a reasonable trough or crest. Values of between -2.5 and 2.5 may only represent a ranging market and you are likely to be whipsawed.
2. Define your trend. If your trend is upward, trade only long stock trades, and if your trend is downward, trade short stock trades.
3. Always keep an automatic stop loss order in place.
4. If your trend changes direction, exit immediately. Do not wait an extra one more day to see if things will come back to what you want - this is where most problems of many traders start.
Formulae:
1. MACD = EMA 12 days prices – EMA 26 days prices
2. Signal = EMA 9 days of MACD values

MACD is a Lagging Indicator
Bear in mind that MACD is a lagging indicator and your entry or exit point may not be lowest or the highest price for your time frame. Many traders criticize MACD as an indicator that fails to respond well to ranging market conditions. MACD is prone to whipsaw and it is very possible that beginner traders may suffer substantial losses if they are not careful. To avoid such losses a trader should only trade in the direction of his defined trend and should have automatic stop loss orders with his stock broker.
If you have liked this article, and you would want this page to keep up and improved, you can help by purchasing some great items from Amazon by following Amazon links and widgets on this page. A free way to help would be to link back to this webpage from your web page, blog, or discussion forums.
The Author’s page is designed to help beginners and average readers make some money as an extra income to supplement what they may be earning elsewhere - details of which you can find in My Page, if you will.


