How to Trade Shares - The Relative Strength Index - RSI - Compute RSI Using Excel
The Relative Strength Index
The relative strength index (RSI) is one of the most helpful indicators that are being used by chartist in trading shares. It actually tells you when to enter and exit a position. The Relative strength index (RSI) is an oscillator that measures the velocity and magnitude of directional price movement of a stock – it compares relatively the upward and downward close to close price movements. One can say it’s a measure of the rate of rise or fall in stock price. The relative strength index was developed by J. Welles Wilder.
RSI is an oscillator that fluctuates between 0 and 100. From this a trader can define overbought and oversold levels, usually 70 and above for overbought and 30 and below for oversold.
To calculate the relative strength index, we use the two formulas below:
Calculate Relative Strength (RS) and Relative Strength Index (RSI):
1. Relative Strength (RS) = Average Upward Price Move / Average Downward Price Move
2. Relative Strength Index (RSI) = 100 - 100 / ( 1 + RS )
Compute RSI Using Excel
Before computing the relative strength index, you have to decide on the time period you want to use. Wilder used a 14 day period, but I use 8 days period to trade short cycles and 21 days period to trade the intermediate cycle.
To compute the RSI using Excel, you proceed as follow:
1. Insert the closing prices data for your stock in column “A” in Excel Spreadsheet.
2. calculate closing price change by inserting “=A1-A2” into column “B”
3. Isolate the rising prices in column “C” by inserting “=IF(B1>0,B1,0)”
4. Isolate the falling prices in column “D” by inserting “=IF(B1<0,B1,0)”
5. calculate average upward price move by inserting “=AVERAGE(C1:C8)” in column “E”
6. calculate average downward price move by inserting “=AVERAGE(D1:D8)” in column “F”
7. calculate Relative Strength (RS) by inserting =ABS(E1/F1) in column “G”
8. calculate Relative Strength Index (RSI) by inserting “=100-100/(1+G1) in column “H”
Note: If you encounter #DIV/0!, then you would have to use a longer period to avoid dividing a number by "0", otherwise you would have to introduce a negligible constant like 0.00001 to “=AVERAGE(D1:D8)+0.00001”
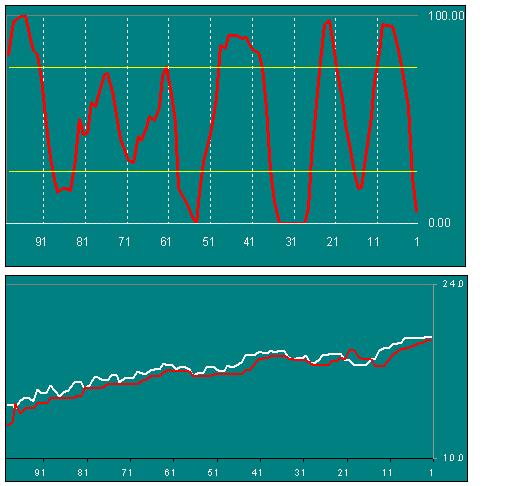
Hold and drag your formulas downward in as much as you would want to go into the past. Now select column H data and draw or insert a chart using Excel. You will now have an RSI oscillator as shown in the image below which you can use for entering and exiting your trades.

Best Books on Stocks
You Must Define the Trend
Important: If you use exponential moving average instead of standard moving average, then 1/8 of today’s data plus 7/8 of yesterday’s data will give you 8-day exponential moving average. If you use the formula for standard exponential moving average, then the formula will equate to 16 – day exponential moving average.
Before you attempt to trade using the RSI, you should have the following:
1. You must define the trend. Only trade using RSI in the direction of your trend.
2. Always use a Stop Loss Order which you will keep on trailing or updating as the market unfolds.
3. Buy stocks when RSI falls below the 30 level and raises back above it, but only if your trend is upward.
4. Short stocks when RSI rises above the 70 level and falls back below it, but only if your trend is downward
If you have liked this article, and you would want this page to keep up and improved, you can help by purchasing some great items from Amazon by following Amazon links and widgets on this page. A free way to help would be to link back to this webpage from your web page, blog, or discussion forums.
The Author’s page is designed to help beginners and average readers make some money as an extra income to supplement what they may be earning elsewhere - details of which you can find in My Page, if you will.


