How to Trade Shares – Williams %R - Compute Williams %R Using Excel
Stock Market
You can either buy shares in the primary market where securities are created by means of an IPO. Once the IPO have sold out then you can only buy those shares through the secondary market. It is this secondary market that people refer to when they talk about the stock market. Today you can trade shares using the “virtual exchange”. A virtual exchange is a network composed of a network of computers where trades are made electronically. This means you can use your brokers trading platform and trade stocks at home by just using your home computer, or better still, you can trade using your mobile phone.
For you to trade successfully, there are technical analysis tools that you need to learn and be able to use them. One such tool is the Williams %R. Williams %R is a technical analysis oscillator that shows the relationship between a stock’s closing price to the high and low prices for a given period of time. This indicator was developed by a gentleman called Larry Williams and hence the name.
Williams %R
The formula for calculating Williams %R is:
%R = (CH/HL) x 100 Where
1. CH is Close today –Highest High for the last Ndays
2. HL is Highest High for the last Ndays - Lowest Low for the last Ndays
This formula will give the %R oscillator on a negative scale, from-100 (lowest) up to 0 (highest). To modify the %R to be on a positive scale,just add 100 to the values obtained so that the lowest value is 0 and thehighest value is 100.
This will therefore give you the formula for Williams %R asfollows:
%R = 100+[(CH/HL)x100]
Overboughtand Oversold levels are normally set at 80 and 20 respectively. The number ofperiods used to calculate Williams %R can be varied according to the time framethat you are trading. I usually use a period of 8 days when I am trading shortterm trades.
Compute Williams %R Using Excel
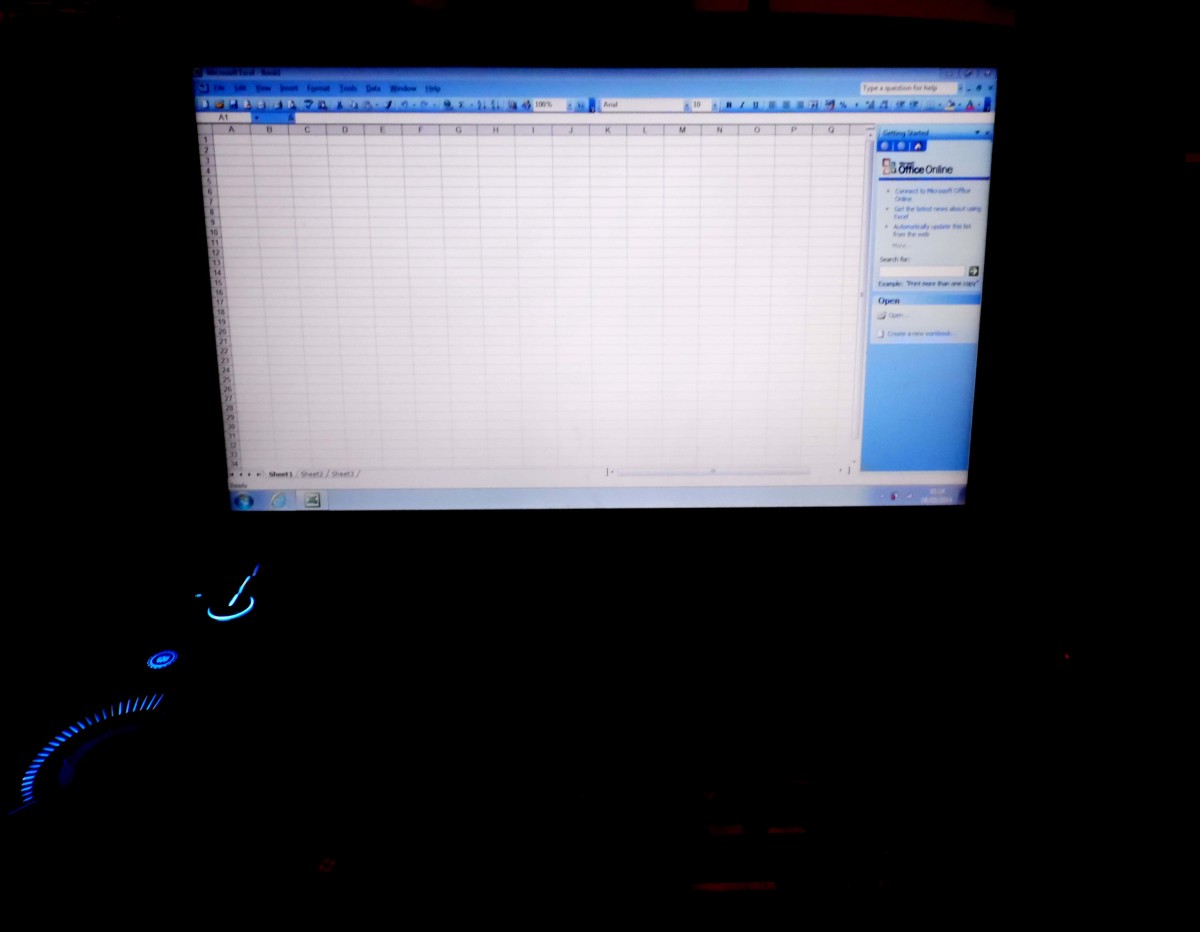
To compute the Williams %R oscillator using Excel, you proceed as follow:
1. Insert the high prices data for your stock in column “A” in Excel Spreadsheet.
2. Insert the low prices data for your stock in column “B” in Excel Spreadsheet.
3. Insert the closing prices data for your stock in column “C” in Excel Spreadsheet.
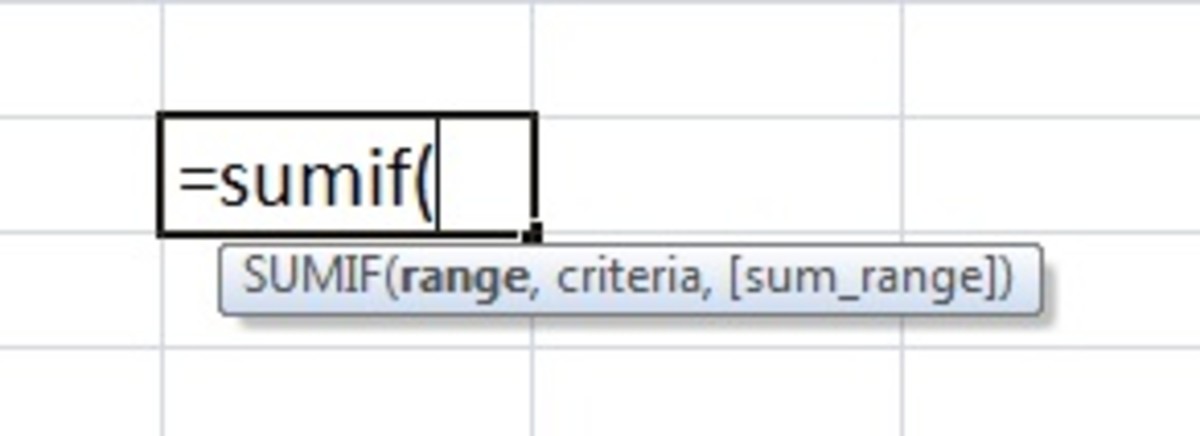
4. Sort out the Lowest Low price for the last 8 days “=Min(B1:B8)” into column “D”
5. Sort out the Highest High price for the last 8 days “=Max(A1:A8)” into column “E”
6. Compute the CH in column “F” by inserting “=(C1-E1)”
7. Compute HL in Column “G” by inserting “=(E1-D1)”
8. Compute Williams %R in column “H” by inserting “= 100+((CH/HL)x100)”
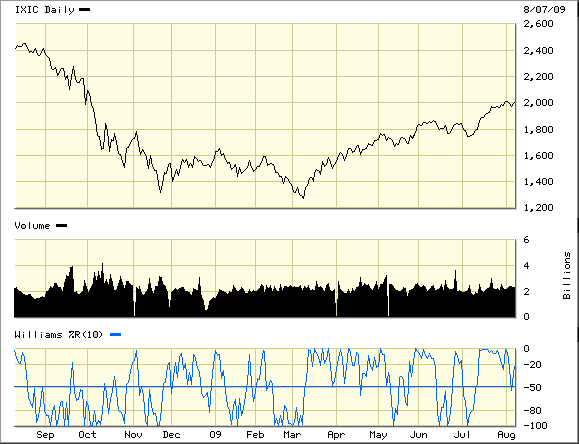
Hold and drag your formulas downward in as much as you would want to go into the past. Now select column “H” data and draw or insert a chart using Excel. You will now have Williams %R oscillators with %R as shown in the image below which you can use for entering and exciting your trades. Once you learn how to use Williams %R in excel then you can latter manipulate it to your liking and the sky will be the limit to what you can do.
Before you attempt to trade shares using Williams %R oscillators, you should have the following:
1. You must define the trend. Only trade with Williams %R in the direction of your trend.
2. Always use a Stop Loss Order which you will keep on trailing or updating as the market unfolds.
3. Buy shares when Williams %R oscillators fall below the 20 level, but only if your trend is upward.
4. Short stocks when Williams %R oscillators rises above the 80 level, but only if your trend is downward.

If you have liked this article, and you would want this page to keep up and improved, you can help by purchasing some great items from Amazon by following Amazon links and widgets on this page. A free way to help would be to link back to this webpage from your web page, blog, or discussion forums.
The Author’s page is designed to help beginners and average readers make some money as an extra income to supplement what they may be earning elsewhere - details of which you can find in My Page, if you will.


