Inflation...Some Truth About The Cost Of Living


The Cost of Living
The basic definition of inflation is the measurement of the changes in the general level of prices of goods and services in an economy over a period of time. Inflation can also be categorized as disinflation, which is the slowing in the rate of growth for the corresponding prices. Or it can be categorized as deflation, which indicates an actual decline in the overall price of goods and services, which is generally associated with a severe economic contraction.
The Bureau of Labor Statistics (BLS) reports on inflationary data through what is known as the Consumer Price Index (CPI) This is a statistical estimate constructed using the prices of a sample of representative items whose prices are collected periodically. There are many versions of the CPI Index. For example CPI-U is an index that is designed to represent the inflationary impact for those residing in urban areas and excludes those in rural areas. This is the measurement which Social Security increases are based upon, as well as the semi-annual changes in dividend payments of I-Bonds from the US Treasury. There is also the Core CPI. The core rate is designed to represent a longer run measurement in the rate of inflation. The BLS does this by excluding items that they feel are likely subject to a greater degree of volatility associated with prices in the short term. Such items are food and energy related products. The real question is whether or not the BLS estimates are a true representation of the actual experiences of the average citizen.
Historical Perspective
What many Americans are unaware of is that the BLS has changed on more than one occasion the manner in which we measure inflation. Historically the measure of inflation was designed to represent a measurement of the cost of maintaining a "Constant Standard of Living", as measured by a fixed-basket of goods. The changing prices of maintaining (meaning the same components/same weighting) of this fixed basket of goods period after period is the simple explanation of the constant standard of living method. This method was used as far back as the 18th century and was known as the Cost of Living Index until the 1940’s. This method evolved over time among academic economist into a “true cost of living” theory or a “Constant Level of Satisfaction” approach. The thought was that the increase in the cost of goods would eventually result in individuals substituting a less expensive product for one that had recently increased. This type of measuring of the price of goods and services is quite logical when attempting to evaluate GDP output of the country because it measures shifts in weightings of actual consumption taking place among the population. But how effective is this approach when you are attempting to evaluate one’s ability to maintain a constant standard of living going foward ?
To maintain a constant standard of living one must assume that an individual/household is able to purchase the same items in the same quantity without having to alter the quality as a result of price changes. The substitution approach is effective at measuring what is actually happening, but not the corresponding impact on the quality of life of a household.
In the early 1980’s and again in the mid 1990’s politicians on both sides of the political aisle together pressured the BLS to alter the manner in which CPI is calculated. Since these changes have developed, CPI now uses geometric mathematical weightings which are designed to automatically reduce the weightings in the calculation of those items that are rising the most. And conversely, it increases the weighting of those items whose prices are declining. The items in this basket are also altered more rapidly. Today the basket is altered about every two years, whereas it was once a reflection of the cost of goods over a ten year span. Economist Walter J. Williams maintains a statistical data base on his webpage http://www.shadowstats.com/ which compares the measurement of the BLS’s CPI data as compared to the same methodology used in the early 1980’s and again in the mid 1990’s. As you can see below, the rapid inflation of the late 1970’s and early 1980’s is not such a far cry from the real world experience of the average American today when utilizing the same methodology that was used at the time. So any comparison to price stability today is greatly flawed as the methodology has been substantially altered. Yet no adjustments are made to the methodology used when calculating the historical data. It is far from an apples to apples comparison.
Hedonic Changes
Another form of the impact of inflation is what is called Hedonic changes. Such changes measure the quality changes of the product the consumer purchases. For example…Imagine if you bought a roll of paper towels for $2.00. Then in a month you went back to the store to buy the same roll of paper towels, yet the roll had less paper in the package. That is form of inflation that is not reflected in the price, but in the quality. The same dollar has delivered a lesser result.
The BLS began attempting to make some adjustments to inflation through hedonic changes in the early 1980’s. However, the methodology of the BLS is impractical, because many of these quality adjustments are not options to the consumer. For example…Imagine that you bought a new cell phone that had an application on the phone included in the price that would allow you to download five new games you could then play for free. Perhaps you had no interest in this feature and would never utilize it. Yet utilizing the BLS method for hedonic changes, the cost of this phone has declined as the quality has theoretically gone up. However, in reality the price may be the same or more, and the value added is of no value to you.
What is the Motivation ???
Why would the BLS and the bureaucrats in Washington wish to underestimate the true cost of living that is experienced by the average American ? There are many reasons. Let’s for example look at the fiscal challenges associated with US entitlement spending. The entitlement programs now consume the largest portion of annual Federal expenditures. The increase in the spending on these programs such as Social Security are directly linked to the inflationary measurement of the CPI-U. Should we underestimate the rate of inflation, the corresponding annual increase in payments can then be underestimated to address the solvency problems. The reality is that there does not exist enough income among the wealthiest of the US population to put a dent in the fiscal liabilities of the nation from a tax perspective. Raising taxes on the lower and middle income earners is not particularly popular from a political perspective, nor is suggesting any direct cut or reduction in entitlement benefits. So altering the method of how we report the cost of living is one way to address cost overruns.
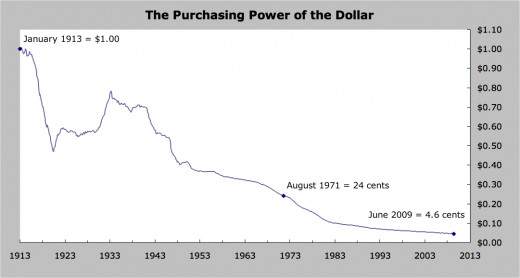
Additionally, the US is in the midst of a massive monetary expansion. The Federal Reserve is purchasing at current about 60% of all new issued treasury bonds. Their balance sheet is approaching four trillion dollars. The creation of all this additional currency is creating inflation. This type of inflation has the greatest impact on those on the lowest end of the economic spectrum. Impoverished people are forced to consume commodities like food and auto fuel. Yet they rarely have direct investments in or own substantial portions of investment portfolios holding commodities that will increase along with the price of these assets. The loss of purchasing power is the hidden tax that is passed on to the population to subsidize the devaluing of the currency by expanding the size of the government. This is necessary, as the only alternative is to otherwise take away services that are popular with the people. Since it is political suicide to suggest a cut to Social Security benefits, the gov’t gives with one hand while they take it back with the other. In fact the US dollar in total has lost more than 90% of its actual purchasing power over the course of the last century.
Many economist in academia, particularly those who fall into the quasi-Keynesian ideology support the BLS methods because they accept the notion that the govt’s fiscal expansion and the corresponding expansion of the Federal Reserve’s balance sheet are currently necessary to fill an economic void. Yet they seemingly ignore the real world experience of the average American. While most Americans may not study the methods of how inflation is calculated, they likely understand that their quality of life in terms of how far they can stretch a dollar is in decline every time they go to a grocery store.
Suggested Reading
- Understanding Medicare Benefits
Health care is an area of major political and economic debate, and many of these laws may be substantially altered in light of potential legislative changes, coupled with the enormous fiscal challenges the current programs like Medicare & Medicai - What should your Financial Advisor ask you ???
Often we read articles & commentary about what to ask your financial advisor. But what should your financial advisor be asking you. Often times that alone can tell you whether or not you are engaged in a financial advisory relationship that is in - Starting A New Job...Understand Your Benefits Packag...
If you’re fortunate enough to have been hired into a new job there can be a number of things that need to be addressed at the beginning of employment. Often times it can be a little overwhelming to address all the issues that come up with regards... - What Are The Hidden Costs of Mutual Funds ???
When it comes to analyzing mutual fund fees, you most often have to turn over more than a few stones to find them all. Mutual funds costs can be broken down into three basic categories. Load funds, no-load funds and no-load funds with a transaction.. - Should I Pay off My Mortgage Early ???
For many Americans, the ability to pay down their mortgage sooner is simply not realistic. However in some cases it is quite possible. The Question of whether or not you should accelerate mortgage payments or use liquid cash to eliminate the... - Life Insurance: What You Need to Know
The question of what type of life insurance is most suitable, typically has to do with factors pertaining to an individuals net worth. The first thing one should keep in mind in all forms of insurance is that insurance is a contract of indemnity.... - The Case for Alternative Investment Strategies
One of the lessons of 2008, and even the more recent market volatility is that portfolio management has become more dynamic. Traditional asset allocation models of equities, fixed income, and cash equivalents may not be sufficient for more growth... - Common Myths about Tax Revenue
Over the years one of the most interesting and politically charged debates has centered around that of income taxes. There are many positions on this that can be debated. However, let’s take a look at some facts around tax revenue from both a... - Preparing For The Tax Law Changes In 2013
The topic of taxes is always one which is greatly debated from both a political as well as an economic perspective. Regardless of one’s political persuasion on such issues, one constant always remains the same. We each do all that we can to avoid... - Annuities: What You Need To Know
What is an annuity ??? Annuities can generally be summarized as two basic types of insurance contracts. They are either immediate or deferred annuities. Over the years these two types of contracts have been expanded to encompass many different...


