Economics 101 For the Political Junkie: Part 4b - Understanding GDP - Government Spending [183e*2]

Using the GDP Identities
I WOULD LIKE TO BEGIN THIS SECTION BY DISPELLING A COMMON MYTH, that large deficits and increasing government debt reduces the amount of dollars available for investment, thereby reducing GDP. I can use this vehicle as a launch pad for where I left off in Part 4a, by making use of the GDP Equation [1] and other information to highlight various aspects about the economy. This is a simple, and useful. one to demonstrate.
Equations We Will Use
- [1] St = I; Saving (private) = Investment, in the long-run
- [2] St = Sc + Sp + Sg; Total Savings = Corporate Savings + Private Savings + Gov't Savings which is St = Sc + Sp + Gt - Ge (Government Revenues - Government Expenses)
- [3] GDP = C + I + G (assume NX = 0)
Let me say that many myths gain traction because there is actually a kernel of truth in them that is then overly generalized until it becomes false; this statement about increasing national debt is no exception. From Part 4a, I reproduced the equations in the box to the right, along with some others. With these, I will first show why the kernel is true, and then show why it isn't, in all cases.
Now let me define four economic periods, 1) recession, 2) stagnation, 3) normal, and 4) heated. The reason for this is that as deficits grow, its impact is felt differently in each period. The theory behind the myth is as follows;
- From Equation 1, we see that in the long run, Investment will equal Savings, I = St
- From Equation 2, we get I = Sc + Sp + Gt - Ge
- As Ge become much greater than Gt, then Sc + Sp + Gt - Ge becomes smaller.
- That in turn means there is less money for Investment which is what those on the Right claim to be the problem, isn't it.
And, it can be a problem during a normal economy if the deficit grows too big too fast. (Note, the "too fast" caveat is there because if growth in GDP can keep up with the increase in the deficit, then the problem is mitigated.)
But, if the economy is in a recession, however, then there is no problem and one of the reasons John Maynard Keynes thought it was fine, and in fact beneficial to run deficits during these downturns. Here is why. The theory is, all of that government debt "crowds out", as the saying goes, private industry from investment money. And this is true, IF they are looking for money to invest in the first place. But, just a tiny bit of critical thinking will lead you to the conclusion that private industry is NOT in the mood to invest during economic downturns. Consequently, the fact that government is sucking up investment money it doesn't matter much UNTIL the private sector decides to invest again.
What's more, consider what the government is doing with these "loans" it is taking out? To show what I mean, let's borrow another equation, number [5]: GDP = C + I + G. (ignoring exports and imports for the moment.) Notice again that GDP is a function of Consumption, Investment (private), and Government Spending.
Now, we all know that economies grow because people and companies keep investing. People keep investing in the economy on the "expectation" that it will keep growing (a sort of "not so vicious circle") in the hopes of making a profit. But, in the long run, the economy grows because either the population grows and/or technology increases output per person even though in the short-run the economy will grow or shrink depending on a whole host of factors; two of which are investing and deficit spending, and both are part of the GDP equation.
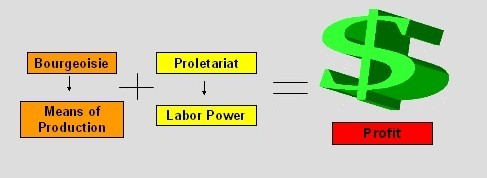
MARX's VIEW OF CAPITALISM
So, if Investing or Government Spending goes up, GDP goes up, if they go down, so does GDP. Let me ask then, what happens to GDP when Investing goes down in a bad economy, it goes down; but happens if Government Spending goes up? GDP goes up, theoretically anyway. Some of you might, or will, disagree. You say government spending has no impact on the economy; but, you would be wrong. There isn't an economist in the world that would support your opinion and equation [5] tells you why.
OK, the finale of this part. There are three (really four, but I am ignoring exports-imports) parts to the GDP equation, 1) consumption, 2) private investment, and 3) government spending. It shouldn't be a surprise to anyone that when business slow down investing, it is because the economy is stalling. When it does that, consumption often declines. If it does, the economy, GDP, shrinks, which, in turn, decreases investment and so on ... the dreaded death spiral.
Many on the Right think that it is fine to let it continue, to run its course with all the attendant unemployment and human misery that accompanies recessions and depressions. They want to do that because they firmly believe exercising the third variable, government spending, because it is useless, wrong (not the business of gov't), or both. Those who believe in Keynesian economics, however, understand government spending does have value in these situations Why? Because by increasing government spending will most probably increase GDP, if it is large enough; aka the dreaded Stimulus.
OK, Let's See How That Works With Numbers
TABLE 1 BELOW PRESENTS A FEW SCENARIOS which hopefully will illustrate the above discussion.
EXAMPLES OF INVESTMENT vs GOVERNMENT SPENDING
ROW
| PLANNED INVESTMENT (I) =
| PRIVATE SAVINGS (S) +
| REVENUE (T) -
| GOVERNMENT SPENDING (G) -
| SURPLUS/(DEFICIT) GOV'T SAVINGS
| SAVINGS AVAILABLE FOR INVESTING
|
|---|---|---|---|---|---|---|
1
| 1500
| 6000
| 1200
| 4000
| (2800)
| 3200
|
2
| 2500
| 6000
| 1200
| 4000
| (2800)
| 3200
|
3
| 3500
| 6000
| 1200
| 4000
| (2800)
| 3200
|
4
| 4500
| 6000
| 1200
| 4000
| (2800)
| 3200
|
TABLE 1
The four scenarios present in Table 1 above show how government deficits can influence investment.
- Case 1 - For whatever reason, investment is depressed, much lower than private savings and less than the $3,200B available in total savings. At this point, the deficit is not an issue and, simplistically, could grow another $1,700B before business investment notices.
- Case 2 - Investment is on the upswing but is still lower than total savings available. Consequently, deficits could grow somewhat, $700B, before making money scarce for investment.
- Case 3 - Investment is really taking off in the short-run, but, because it exceeds available savings it must come down if nothing else changes. Two possible issues which might result from the pressure is higher interest and inflation rates.
- Case 4 - Investment is now soaring in the short-run and exceeds available savings even more. This will almost certainly push up both inflation and interest rates. In the long-run, those increases will drive investment back down.
Of course there is another solution to cases 3 and 4. And that is to lower the deficit by a combination of lower spending (which drives GDP down) and/or higher taxes, which both raises (by reducing the deficit) and lowers (by reducing consumption) GDP; Table 2 shows you how that works.
ROW
| PLANNED INVESTMENT
| PRIVATE SAVINGS
| GOV'T REVENUE
| GOV'T SPENDING
| SURPLUS/(DEFICIT) GOV'T SAVINGS
| AVAILABLE SAVINGS
|
|---|---|---|---|---|---|---|
1
| 4000
| 6000
| 1200
| 4000
| (2800)
| 3200
|
2
| 4000
| 6000
| 2000
| 2000
| 0
| 6000
|
3
| 4000
| 6000
| 2000
| 4000
| (2000)
| 4000
|
TABLE 2 - ROW 1 IS A RECREATION OF ROW 4 IN TABLE 1
Row 1 in Table 2 is Row 4 in Table 1 where investment is $700B in excess of available savings; an economically unstable situation. On the other hand if taxes were raised by $2,200B and spending reduced by $2,000B, then we now have a balanced budget. As a consequence, available savings rises to the level of private savings or $6,000B; more than is needed for the planned investment, and then some.
But what happens if planned investment crashes, like during a recession? Table 3 gives us the answer (Row 3, Table 2 is used for the following discussion.)
ROW
| GDP
| CONSUMPTION
| INVESTMENT
| GOV'T SPENDING
| STIMULUS
|
|---|---|---|---|---|---|
1
| 20000
| 12000
| 4000
| 4000
| 0
|
2
| 18000
| 12000
| 2000
| 4000
| 0
|
3
| 16000
| 10000
| 2000
| 4000
| 0
|
4a
| 16300
| 10000
| 2000
| 4000
| 300
|
4b
| 17200
| 10500
| 2000
| 4000
| 700
|
4c
| 18500
| 11000
| 3000
| 4000
| 500
|
4d
| 20300
| 12000
| 4000
| 4000
| 300
|
4e
| 20000
| 12000
| 4000
| 4000
| 0
|
4f
| 21000
| 12000
| 4000
| 4000
| 1000
|
4g
| 19500
| 12500
| 3000
| 4000
| 0
|
4h
| 19000
| 12000
| 3000
| 4000
| 0
|
TABLE 3 - A VERY SIMPLIFIED VIEW OF HOW A STIMULUS WORKS
CIRCULAR FLOW OF ECONOMICS

Admittedly, this is an extremely simplified scenario of how a stimulus is supposed to work. It also shows when it won't work.
- Row 1 sets up the scene where GDP ($20,000B) = Consumption ($12,000B) + Investment ($4,000B) + Gov't Spending ($4,000).
- Row 2 introduces an Investment shock by cutting it in half, meaning for some reason business is not interested in investing their money, and therefore must lower GDP by $2,000B to $18,000B
- Row 3 reflects lower Consumption due to negative growth
- Row 4a applies a long-term stimulus, $300B in first year and another $1,500B over the next three years.
- Rows 4b - 4d work through the dynamics of a stimulus during an economic downturn until,
- We're back to normal in Row 4e
- Row 4f introduces a "stimulus" while the economy is good.
- Row 4g demonstrates the predictable result of doing this ... a decrease in Investment because the "stimulus" drove the deficit from Row 3, Table 2 up by $1,000B which, in turn, brings available savings below Investment
- Row 4h carries the turbulence one step forward.after the stimulus has ended.
To recapitulate. The above demonstrates why, when business is not investing, government stimulus, by way of increased deficit spending, potentially can bring the economy back up by making up for the spending business refuses to do. On the other hand, we also see why, when a stimulus is introduced AND I = S, investment and growth are depressed,
As I said, this is a very simplified version of a very complex process with many moving parts. But, the mathematics of economics, mainly GDP = C + I + G, helps bring this complexity into the realm of understanding.
WHAT DO YOU BELIEVE?
Do You Believe ...
DEMOGRAPHIC SURVEY
Are You Mostly Likely to Agree with the Positions of _______ Side of the Political Spectrum?
© 2015 Scott Belford
Related

Economics 101 For the Political Junkie: Part 4a - Understanding Gross Domestic Product
")
A Short History of American Panics, Recessions, Depressions: Why Conservative Economics Can't Work - Part I (Updated)

Teaching Gender Identity to Kids: Pros and Cons of Starting Early

“There are two side to every question …”

What is the Difference Between the U.S. National Debt and the Deficit?


