Gun Rights: Part 5: A Deeper Look: Can Reasonable Gun Control Save Lives?

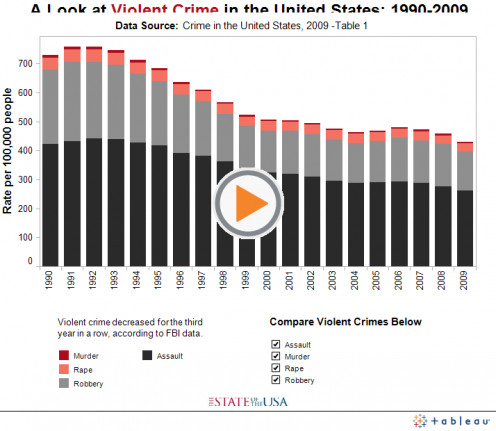
Relooking at Violent Crime
WHEN WE LAST LOOKED AT VIOLENT CRIMES, and its relationship, if any, rate of gun ownership we found the answer was ... not much. If fact, with the independent variables we considered a good explanatory model could not be developed at all. So, as promised, I dug deeper and was able to produce useful models although they still do not involve guns ownership to a large degree.
If you haven't read the other Parts, you will probably need to for these are somewhat technical hubs where I lead the reader on how I did my analysis. But. even though I try to make them understandable and not boring, it is word consuming and runs the risk of leaving you disinterested. Consequently, because the methodology is the same, I will dispense with it in these hubs.
Further, at the end of each segment, I will include a word summary of the meaning of the equations that were presented and you can skip to these paragraphs if numbers are not your forte or you don't want your eyes to water. I take the time, and risk of losing you, to develop and present these mathematical models because I want to ground what I am saying in as much reality as I can, using real-world numbers to produce useful (hopefully) models to help understand how gun ownership is wrapped up in crimes and death.

Forcible Rape
WITH THIS CATEGORY, AS WELL AS THE OTHRS, I searched for new explanatory variables that common sense says are related to the dependent variable, Forcible Rape, or, I considered a more detailed look at an explanatory variable already considered.
One such variable that appeared in most of the constituents of Violent Crimes involves major population centers, a variable several commenters hit upon as being important. Previously, I simply counted the number metropolitan statistical areas (MSA) over 500,000 people, over 1,000,000, and over 5,000,000 population. While this helped, and did improve the resulting models, it wasn't enough. Nevertheless it did tell me I was on the right track.
In the previous model from Part 2, I couldn't find any correlation with any of the variables I used at that time and therefore didn't present a model. In later calculations, I used the counts of MSAs where a weighted total of the three groups proved useful to some extent, but not enough to present. Here, I took the idea one step further and totaled up the number of MSAs in a state and figured out each MSAs average population; now that should really help, or so I thought. Unfortunately, it was only partly successful. The count of MSAs was not important, but how big the average population of those MSAs was relative to the states total population was.
The original unsatisfactory formula from Part 2 was:
Ln(Rate for Rapes) =
2.14566 +
e^(0.89008*Rate of Gun Ownership),
where ' ^ ' means "raised to the power of".
This form produced a R2 of only 24%. In later analysis, not presented in the hubs, I found a better equation with:
Ln(Rate for Rapes) =
9.332925 +
0.233638* Ln(Rate of Gun) -
0.15534*Ln(Ratio Urban Pop to Tot Pop) -
1.77755*Ln(Avg Age)
: R2 = .42
Here, we raised the R2 to 42%, better, but still not impressive. Unfortunately, I couldn't do any better with what I was using.
So, the bottom line is that even though Rate of Gun Ownership has some explanatory value, i.e., more guns = more forcible rapes, it isn't much. There are some other variables which I haven't considered that are more important and may even overwhelm any influence of gun ownership.
Aggrevated Assault
AGGREVATED ASSAULT ALMOST SUFFERS the same fate as the previous constituent of Violent Crime, we the independent variables that were considered, no viable model could be produced; the best that I came up with had and R2 of around 37%, which is not acceptable. There is, fortunately, a statistical technique that can occasionally be employed when certain conditions are met, conditions that weren't available with Forcible Rape.
The unmodified model I came up with is:
Ln(Ag Assault) =
.583 -
.017*e^(Average Age/10) +
1.415*Ln(Mean Temperature)
: R2 = 33%
Temperature came into consideration on the theory that the hotter it is, the more likely people are going to be out and about as well as tempers becoming shortened. This particular model had an R2 a 33%, others had and additional significant variable, but it had to be dropped for the next transformation.
In the above model, both Age and Temperature were very significant, while the intercept, the .583, was not. Normally, the intercept is left in the equation, even it is not significant. You can, however, set it to zero and recalculate the results when three conditions are met: 1) it is possible for the independent variables (Age, Temp) can become zero at the same time, 2) that when they do, it is logical to presume the dependent variable (Assault) would go to zero as well, and 3) although improbable, it is all nevertheless logical. With Aggravated Assault, we have met those three tests.
With this model, I ask the question, "Can the Avg Age in a state and the Mean Temperature be zero at the same time?" While there is almost a zero chance it will ever happening, there is nothing preventing it. For example, take the North Pole with a newborn baby who is abandoned there. The Mean Temperature is certain below zero and for all practical purposes, the mean age is zero as well. Then we ask, "Is it reasonable to assume that given these conditions, would we expect Aggravated Assaults to be zero as well?:" I think you would agree the answer is yes, even if there were two abandon newborns. Finally, "As improbable as this scenario is, does it make logical sense?" I would argue that it is.
When we have met these conditions, we can set the intercept, currently .583, to zero and rerun the regression. When we do this, there is a dramatic improvement; in fact the adjusted R2 goes to 97%! The formula is:
Ln(Ag Assault) =
15.996/(Avg Age)^.5 +
.389*(Mean Temperature)^.5
where something raised to the '.5' power means taking the square root.
: R2 = .97
When I put values back in from known states, it actually worked pretty well, given paucity of meaningful predictors (age and temperature). Common sense says there must be more, but when I tried to incorporate something like major population areas but, it didn't help; % Gun Ownership was out of the running early on.
But in any case, Age and Temperature acted as expected, as the population ages, Assaults decrease and as Mean Temperature increases, so does the Assault rate.
ROBBERY
WITH ROBBERY, WE HAVE OUR FIRST VIABLE MODEL. The R2 is 78%, which is getting into an acceptable range for this means we have potentially explained 78% of the variations in the Robbery rates among the states with the four, in this case, predictors that ended up being used. In the previous two components to Violent Crime, the best model we came up with explained less than 40% of the variations.
To produce this model, we needed some new predictors and they have to do with the economic make-up of the population. Our equation now looks like:
(Rate of Robbery)^.25 =
9.113 +
.071*(# Urban Areas)^.5 -
2.051*(% Graduated College)^.25 -
2.464*( % Gun Ownership)^1.35 -
1.567*(% non-minority)^2.5
: R2 = .78
The definition of Urban Areas (MSAs) was covered a couple of sections ago; % Non-Minorities and % Graduated College, however are a new predictors. Both reflect economic conditions in that minorities represent, as a group, a more economically depressed cohort. On the other hand, % Graduated College can be a measure of relative prosperity. What this equation implies is that the Rate of Robberies will increase if 1) the number of Urban Areas increase, 2) the percentage of college graduates decreases, 3) the rate of gun ownership decreases (interesting!), and/or 4) the % of non-minorities decreases. I did look at other variations, such as high school graduation rates, median income, temperature, age, and the like, but none of them panned out. Also note that if I drop any of the independent variables out of the equation, the other variables may become less significant and the model as a whole becomes less predictive.
MURDER
IF YOU LOOK BACK TO PART 2, YOU WILL SEE that we couldn't come up with a good model where gun ownership alone is used to predict Murder rates. Looking deeper. One can develop better, but ultimately not useful models. The predictors that made it into the final equation are Rate of Gun Ownership, Minority demographics, % of Men in the Population, the Area of the state, and, if I relax the restrictions from tossing a variable out, Temperature.
Without Temperature, the R2 is 56% and, if we allow significance at the 90%, vice 95%, then with Temperature in, the R2 is 57%.
Notice what is not included ... anything to do with population centers. It would seem counterintuitive that large population centers wouldn't be a factor because of all the notoriety of such places as Chicago, New Orleans, NY City, Washington D.C, Los Angeles, etc relative to the number of murders. But that is the problem with anecdotal information. The fact is the 10 most deadliest cities in 2012 when rated by per capita murders. They are:
- Flint, MI
- Detroit, MI
- New Orleans, LA
- Saint Louis, MO
- Baltimore, MD
- Birmingham, AL
- Newark, NJ
- Oakland, CA (tied with Newark for 7th)
- Baton Rouge, LA
- Cleveland, OH
- Memphis, TN
Notice that the populations of these top 10 vary all over the map; you have a broad mixture of high population centers, e.g., Newark and Oakland, as well as a selection of medium and small (relatively speaking) sized cities, e.g. Flint and Baton Rouge. When you have a random mix (heterogeneous) of population size, that makes them very poor candidates as predictor variables.
In any case, the best model I could come up with using the most common variables is:
(Murder Rate)^.5 =
1.570 +
1.436*(Rate of Gun Own)^1.35 -
2.234*(% Non-Minority)^2.4 +
1.253*(1/(2*% Male)^15.5 +
.013*(Avg Temp)^1.1 -
7.154*(1/Area^.2)
: R2 = .64
My, my, with all those predictors, the best "goodness of fit" (R2) the model produces is 64%, almost good enough to consider using ... almost. You would think with all of those significant variables, the model would do better but there is 36% of the variation in our murder rate between the various states is still left to explain.
You might think a couple of the new independent variables (predictors) are rather strange i.e., Average Temperature and the size of the state. It has often been shown that crime, in general, slows down during the colder months or when the weather is bad. Average Mean Temperature in a state acts as a nice surrogate for this effect, which is why I tried it out.
If you notice, what is not in the model are variables which represent large urban areas, where several commenters has suggested is a factor. After trying several different ways to introduce this idea into the equations, in the end, I failed to find a significant correlation. However, I didn't give up the idea entirely and tried looking at the total size of the states. The thinking is the larger the state, the more sparse the population overall. I tried densities. both gun and people, but that didn't work; but state size did.

Do the Predictors Predict As One Would Expect?
IF YOU SCAN THE MODELS FOR EACH OF THE ELEMENTS of Violent Crime, you will notice there was no common predictor between them. I am not sure about you, but I find this strange; nevertheless, it is what it is. Between the four, the breakdown goes something like this:
- Rate of Gun Ownership - 2 models
- Mean Temperature: - 2 models
- Median Age: - 2 models
- # of large Urban Areas: - 1 model
- Average Urban Population - 1 model
- Ratio of Urban Population to Avg. Urban Population - 1 Model
- % of Males in Population - 1
- % of Economically Depressed Minorities - 2 models
- Area (square miles) - 1 model
That is quite a spread for crimes whose common thread is the seriousness or degree of violence associated with them. Of interest of course is how these predictors enter the model, i.e., how do they affect the models outcome? To do this you look at the sign ('+' or '-') of the variable and how the variable is formulated, meaning, is the variable direct, e.g., 'X' or is it inverse, e.g., '1/X'. In the 'X' case, the answer increases as 'X' increases and in the '1/X' version, the answer decreases as 'X' increases. The same is true for the sign, if it is positive, the answer increases, and if negative, the answer decreases.
Rate of Gun Ownership
In the two cases, Rape and Murder, where the Rate of Gun Ownership is present, as its rate increases, so does the rate of Rapes and Murders. Even though the models do not explain enough of the variation, 42% and 64% respectively, for, in my estimation, the model as a whole to called a good predictor, they nevertheless account for a significant portion of variation in the components we are trying to predict. As such, the predictor variables in the model are, at this point in time, significant components.
What this outcome means in political terms is that the Pro-Gun Regulation lobby can take a small degree of comfort in their claim that the prevalence of guns in a community is directly linked to the rate of those two components of Violent Crime. e.g., more guns = more rapes and murders. But, don't go touting this as proof of your position, it isn't; for as more explanatory variables are identified which ultimately will make these good models, the influence of gun ownership may decrease or disappear altogether.
The more certain result from this analysis is that, contrary to the Pro-gun groups claim, having more legal guns in a community does not reduce the number of rapes and murders. At best, it has no influence at all. Further, the rate of gun ownership did not factor in at all when we consider Robbery and Aggravated Assault.
Large Urban Populations
This was one of the surprises to me. Like several of my commenters, I thought this factor would play a significant role in all four components of Violent Crime, but, as we see, it didn't.
Looking at the Larger Picture
WE HAVE NOW TAKEN A CLOSE LOOK AT EACH COMPONENT of Violent Crime, what can we say about the category itself? We will first look at what I call Crime Lite, which is the sum of Murder and Robbery, the two categories which seems most related to the use of guns. Next, Violent Crimes as a whole will be considered.
Crime Lite
IT WOULD SEEM MURDER AND ROBBERY would be the crimes most likely to have guns involved while they were being committed. It didn't, however, work out that way. Instead, like for Robbery, it took several predictors to come up with a useful model, but come up with one I did; it has an R2 of 74%, almost 3/4's of the variance is accounted for. In this case they are:
- Land area
- Non-economically disadvantaged minorities
- A combination of three variables covering population density.
And the equation is ...:
(Rate of Murders and Robberies)^.2 =
2.185 +
1/Area^.25 -
.993*(% non-minority)^2.5 +
.066*( # of Urban Areas)^.5 +
.0007*(Avg Pop per Urban Area)^.5 -
3.7E-7*(Pop Density/10)^2 (simple, right?)
: R2 = .74
What this says is that Crime Lite increase when 1) the state is smaller, 2) % of non-minorities decreases, 3) the number of urban centers increase, 4) the average size of an urban center increases, and/or 5) the overall population density decreases. What those last three factors imply is that as the population of a state becomes more concentrated in urban centers, Crime Lite increases.
Violent Crime
THE LAST THING TO CONSIDER REGARDING VIOLENT CRIME is Violent Crime itself. To recapitulate, Violent Crime consists of Forcible Rape, Aggravated Assault, Robbery, and Murder. So far, only Aggravated Assault and Robbery have produced useful models as individual components and Crime Lite was significant as a combination of Robbery and Murder. In all of these, however, the rate of gun ownership was significant only with Robbery, and in that case it fit the NRA model of More Guns = Less Robberies. Violent Crime, when considered as an umbrella descriptor does not produce a useful model at the level that I like, and again, the model it did produce didn't contain the rate of gun ownership or gun density.
The best model I could come up with for Violent Crime is one with an R2 of 59%; not bad, but
not good either. Only three independent variables made it into the model, 1) non-minorities, 2) college graduation, and 3) ratio of average size of urban areas to total population. The final equation we will consider in this Part is:
(Rate of Violent Crime)^.2 =
5.66 + .
4*1/(Ratio of Urb to Total Pop) - .
905*( % of non-minorities)^2.5 -
1.567*( % College Graduates)^.25
: R2 = .59
From this, you can draw the conclusion that you can reduce the rate of Violent Crime with any combination of the following: 1) reducing the total population in urban areas relative to total population (not likely to happen), 2) improving the economic and social conditions of minorities (e.g., reduce discrimination, improve schools), and/or 3) improving the college graduation rate (state educational level). None of these variables, it can be seen, are related to gun ownership even though it appears in a couple of the components of Violent Crime.

Concluding the Violent Crime Story
THE BOTTOM LINE FROM THIS HUB FOR ME is that the jury is still out on whether better regulations on legal gun ownership would help or hurt the rate of violent crime, or any of its components, in America. As I have mentioned earlier, I was frankly surprised the components of murder and robbery did not register a strong positive relationship with gun ownership; but, it is what it is and neither the pro-gun nor the pro-gun regulation lobby can take solace from my results.
To rehearse the results:
FORCIBLE RAPE - I actually have two model's for this factor of violent, the one presented above, and an alternative model I developed using additional variables might be relevant. Neither rose to the level of a useful model for prediction purposes, both presented a "goodness of fit" statistic, R2, in the 42% to 45%. In the one case, the one above,
-- forcible rape could be theoretically reduced by
- decreasing the availability of legal guns,
- increase (??) the size of urban population relative to total population, and/or
- increase the average population age.
- The second factor seems rather problematic, doesn't it? But, that is what the data produced.
- Alternatively, forcible rape can also be theoretically reduced by
- increase the average population age,
- increase the college graduation rate,
- increase the density of guns, and/or
- decrease the size of the area the population lives in.
Notice that in both cases, the rate of gun ownership entered the picture either directly in terms of the rate of ownership, or indirectly by considering the density of legal guns per square mile; but, in both cases, there is only the smallest of contribution to the overall rate of this crime. Because average population age and the geographic size of the space we are considering are static (can't easily be changed by public policy) the only other variable that can be controlled is the education level of the population where the data suggests that the more educated a given population is, the less occurrence of forcible rape occurs. This predictor has significantly more influence on the final outcome than guns do, but even here, it isn't that great.
AGGRAVATED ASSAULT - With this component, we developed a pretty good model, in terms of its significance and predictability relative to the predictor variables used. They were 1) average population age and 2) mean temperature; no other variables, of all of the ones I considered, were found to be significant. In the final analysis, the model suggests that Aggravated Assaults will be lower in colder climates with an older population.
ROBBERY - This violent crime factor proved much more interesting. It was a viable model with a "goodness of fit" R2 of 78% and included four predictor variables that seem to be related. They are:
- The number of Urban Areas (population concentrations) in a state
- The college graduation rate, implying a certain level of education in a state
- The rate of legal gun ownership which describes the availability of weapons to both criminals (since the major source of guns for criminals are from legal resources) and law abiding citizens as well
- The percentage of well-to-do ethnic groups in a state, which reflects the relative wealth in a state.
In this model, as you can see, gun ownership does play a role in decreasing the number of robbers, and not a minor one at that. For example, if you increase the rate of ownership 100%, say from 21% (California) to 42% (Iowa), you decrease Robberies, according to the model anyway, the rate Robberies will decrease 34%, not too bad at all. On the other hand, if you increase college graduation rates only 58%, sat from 19% (Arkansas) to 30% (California), you get a somewhat better improvement, in this case 38%. In any case, to decrease the rate of Robberies, you can do any combination of the following:
- Reduce the number of Urban areas (not likely to happen)
- Increase the education level of the population in a state
- Increase the rate of gun ownership
- Increase the economic prosperity of minorities.
MURDER - With this category, the model we developed is not, at an R2 of 64%, as good as I would like, but it is close. Another point of note is that while the rate of gun ownership once again enters into the equation, it is in the opposite direction than it is in Robbery, but has about 1/2 as much influence. To repeat the scenario from the Robbery discussion, we find that doubling the rate of legal gun ownership increases the Murder rate by
- Reduce the rate of legal gun ownership
- Improve the economic prosperity of minorities
- Reduce the ratio of Men to Women (not a public policy option)
- Reduce the mean temperature (not a public policy option, but climate change may increase it and the murder rate)
- Reduce the size of the state (not a public policy option)
CRIME LITE - Not surprisingly, when you combine Murder and Robbery into a single element, whose common component is the predominant use of guns in their commission, the rate of gun ownership drops out of the resulting model. It is not surprising because the prevalence of legal guns has opposing effect, in one case, Robbery, mitigating the occurrence and magnifying it in the other, Murder. What is left over has the following impact on reducing Crime Lite::
- Reduce the physical area the population is located in (not a public policy issue)
- Improve the economic prosperity of minorities
- Reduce the number of Urban areas (not a public policy issue)
- Reduce the average population per Urban area (not a public policy issue)
- Increase the population per square mile (not a public policy issue)
This is a reasonably acceptable model with an R2 of 74%. What I find extremely interesting is that the only variable which public policy can resolve is the economic prosperity of minorities. To expand a little on this subject I found that there is a significant different between the median incomes of Whites and Asians on the one hand (with Asians being the more prosperous) and Blacks and Hispanics on the other. Choosing the percentage of non-economically challenged racial groups (relative to others) allows me to encapsulate this and many other social issues that separate how groups of people view the world in a single number. And, it makes sense to me this predictor variable acts in the way it does.
VIOLENT CRIME - Our final category is Violent Crime itself, with all four components combined. Again, we see that the prevalence of guns in the population is not a factor because of its countervailing effect on each of the individual components. The other variables which are still present, in one form or another but they don't make a very useful equation; in this case the R2 is 59%. Nevertheless, here is what it tells us about reducing Violent Crime:
- Reduce the ratio of total Urban population to total state population.(not a public policy option)
- Improve the economic prosperity of minorities
- Improve the educational level of the state's population
You can see that, of those things public policy can influence, two variables keep appearing, the last two in the list above. The inclusion of education in the mix is pretty straight forward, the issue surrounding minorities is not. I have previously explained why I think this variable appears in the model, but now I want to dig a little deeper. Personally, I don't think that, except for the social and economic impacts of discrimination, race or ethnicity is a factor at all but, instead, the conditions in which they and all other ethnic groups live. Specifically, I am considering poverty for its magnifying effects on the commission of crimes are ubiquitous; cutting across all ethnic lines.
I am sure many of my conservative and minimal state liberal friends will disagree with the previous assumption. Their fundamental belief is each American has, at birth and while growing up, the same chance as any other American to succeed to the level of their abilities; that there is nothing holding them back but their lack of desire to succeed the position. My active state liberal friends will absolutely disagree with this position by taking the position reflected in the following statement from Herbert Crowly, who wrote the book on active state liberalism and was read by such notables as both President Roosevelts:
"The chance which an individual has to compete with his fellows and take the prize is vitally affected by by material conditions over which he has no control. It is as if a competitor in a marathon cross-country run were denied proper nourishment or proper training, and was required to toe the mark against rivals who had every benefit of food and discipline. It would be absurd to claim that because all rivals toed the same mark, a man's victory or defeat depended exclusively on his own efforts. Those who enjoy the benefit of wealth and thorough education start with an advantage which can be overcome only by very exceptional men; men so exceptional, in fact, that the average competitor without such benefits feels himself disqualified from the contest."
That is definitely sums up the way I view the American scene. My personal analogy is a little bit more severe, having to do with rolling boulders down a hill, but this quote is certainly succinct. It also supports the fact the the median incomes of Blacks and Latino's are, in the overwhelming majority of cases, significantly less than Caucasians and even more so with Asians, who are doing quite well, thank you. Having said that, there are a large number of Caucasians who also fall well below the median income for all Caucasians, about $50,000/yr; the point where half the households earn more and half earn less. What is important, however, is that total income earned is so heavily leveraged by the very wealthy that in terms of the $7.7 trillion earned in 2007, a full 80% of it, $6.2 trillion, is earned by that 50% whose annual income exceeds $50,000. Consequently, that leaves a measly 20% or $1.5 trillion to be spread out among the other 50% of U.S. households.
Even though I am talking about all earners, irrespective of race, creed, or ethnic background that are subject to such a disparity in income equality, the data shows the disproportionate number of households being those from Blacks and Latinos, the minority groups I used in my analysis, which makes this a reasonable candidate for including in the model as a substitute for economic inequality. A better one might be an analysis of the stratification of income levels within a state, which, to a small degree, removes ethnicity from the equation; but, I will save that job for another hub.
I will conclude this series, at least for now, with Part 6 which returns to looking further at total deaths, but now with a lot more information available.
So, What Do You Think Now
WHICH ONE OF THESE STATEMENTS DO YOU AGREE WITH?
© 2013 Scott Belford
Related

Why Are Some Gun Owners Against Reasonable Gun Control?

Gun Rights: Part 3: Gun Regulation: Will Reasonable Gun Control Save Lives?

Does Gun Control Reduce Crime? Looking at the Statistics
")
14 Arguments For Gun Control (Simulated Debate)

Gun Control and the Right to Bear Arms: a Foreign Perspective on the Pro-Gun Lobby


