The Top 10 Worst Foods for the Planet

Disclaimer: The text that is lined through are broken links. They are evidence of my claims. I left them in for proof that I used evidence.
The criteria for harmful world foods is not just about CO2 production. It also includes methane production, water use (water footprint), land use and land degradation and other chemical outputs. Some food products have lots of data attached to them, like cattle. Others are not so easy to obtain certain data for. Moreover, the sources might use different measurements for the same impacts. One site might use CO2 per acre, another might measure it as CO2 per kg of product while yet another will use CO2 per pound. I am scoring these holistically, and have done my best to address these differences. In the end, even when using criteria, the ranking has some subjectivity. I score loss of rainforest and other arable land higher than chemicals used. Others might put carbon footprint higher, in fact, many do. Less subjective is the fact that the amount and way these products are produced is not sustainable, and a reduction in their consumption is the best solution.
Note: People have asked me if foods that are bad for the planet means that they are bad for humans. I am not addressing that issue here. For example, hemlock is extremely dangerous to humans if ingested, but the cultivation of hemlock is not releasing anthropogenic green house gases (GHG), using huge amounts of water nor destroying habitats or ecosystems. This is about what foods that harm the environment of the planet. The fact that some of these foods also harm humans is additional incentive for changing how we consume them.
1. Cattle
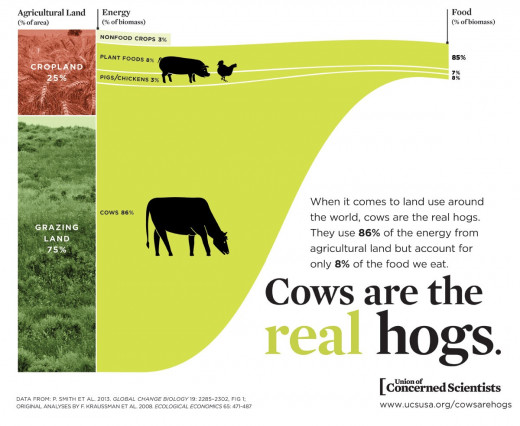
Cattle leads or is near the top in every climate damaging category. Cattle is second in carbon footprint to lamb, but because there are millions of more pounds of cattle on the planet (though there are more sheep in number), they are number one in CO2 production as a species. Cattle have the largest water footprint, release tons of methane, use millions of acres of arable land and production of grain for cattle feed uses millions of pounds of pesticides, herbicides and other chemicals.
More Reasons Cattle is #1
Beef production releases “five times the amount of greenhouse gas emissions as the average of other meats and animal products…Beef requires 28 times more land, 11 times more water, and six times as much reactive nitrogen as the average of the other categories, according to the study.” Beef is not efficient nor sustainable for a world population of over 7 billion people.
Carbon footprint: Cattle production releases lots of GHG. In fact, there is “…27 kg of carbon dioxide and methane produced for every kilogram eaten…” (huffpo) Again, because of the weight, size and importance of cattle, it IS number one.
Methane Footprint: Cows are also number one because “Cows produce 35% of man generated methane...” A cow, on average, releases between 70 and 120 kg of Methane per year, a more potent GHG than CO2, “…the negative effect on the climate of Methane is 23 times higher than the effect of CO2. Therefore the release of about 100 kg Methane per year for each cow is equivalent to about 2'300 kg CO2 per year.” (ibid)
Comparing various meats CO2 output:
1 kg of meat produces X kg of CO2
beef 34.6
lamb 17.4
pork 6.35
chicken 4.57
Source: Environmental Impacts on Food Production and Consumption
More facts about cows, CO2 and methane can be found at timeforchange.org.
And for cattle, “The largest source of GHG in beef production comes from the methane produced in the gastrointestinal tract, accounting for over 60% of total emissions.”
Water Footprint: For 1 kg of beef, farmers use 15,500 liters of water (WFP), or 2500-5000 gallons, (TH) That is the most of all the meat we eat. Also, 1 pound of Beef uses 1,857 gallons of water (SOY). The only food product that matches beef in water use is chocolate.
Land Use/Destruction/Deforestation: Millions of acres of land have been clear-cut for cattle in Latin America (broken link, sorry), “Throughout Latin America, rainforest conversion is dominated by the establishment primarily of pastures but also cropland, irrespective of the characteristics of soils, climate regimes, and topography. Pasture occupies the largest proportion of the agricultural land in the region...” (FAOA)
First, the Amazonian rainforest, the lungs of the planet, are clear cut or slashed and burned so humans can eat more beef and have more cheese. Introducing the cattle not only increases GHG into the atmosphere at a record pace, but it destroys the best carbon sink the planet has, thus creating a positive feedback loop of ever increasing GHG production and atmospheric carbon. Moreover, clear cutting the forests decreases moisture in the soil and increases the impact of recent droughts. During a drought, the rainforest sequesters less CO2.(For more, read my previous article on climate change.)
Half of the CO2 is absorbed back into the land and other carbon sinks. The other half stays in the atmosphere trapping heat and increasing global temperatures. If carbon capture is reduced through deforestation, the effects of climates change increase.
Thus, more CO2 is released and remains in the atmosphere for centuries, “Individual carbon dioxide molecules have a short life time of around 5 years in the atmosphere. However, when they leave the atmosphere, they're simply swapping places with carbon dioxide in the ocean. The final amount of extra CO2 that remains in the atmosphere stays there on a time scale of centuries.”
Chemical Pollution/Pesticides/Herbicides: Manure is a problem for all livestock production, “According to the EPA, ‘A single dairy cow produces about 120 pounds of wet manure per day, which is equivalent to the waste produced by 20–40 people...this amounts to about 130 times more excrement than is produced by the entire human population every year.[6]” This waste is not treated, so bacteria like E. coli and Salmonella reside in the waste. And some of this waste gets mixed with water and sprayed on the land. (ibid) We will talk about two main grains for cow feed, soy and corn, later. We will leave that part of the chemical footprint of cattle for later.

2. Chocolate
Chocolate is a combination of ingredients that make it unique. The combination of products that go into making chocolate and its environmental impact is important enough to put on the list. It includes the carbon and methane production of the cattle industry with the clear cutting and land uses of the cocoa bean and other ingredients. Chocolate is not great for the planet, to say the least, especially in large quantities.
Carbon footprint: Chocolate's carbon footprint is more than most vegetables, but less than ruminants, “A two-ounce bar of chocolate has a carbon footprint of 169grams.” (OGP) Thus, 0.44 kg of chocolate would release 1.332 kg of carbon.
Methane Footprint: Methane output from chocolate mainly comes from milk cows burping. There is also the methane from the cane sugar and other ingredients, “Studies show that the production of one litre of milk produces the equivalent of 900g of CO2. More than half of this is down to methane. The average cow emits between 80kg and 120kg of methane a year, equivalent to the annual carbon emissions from an average family car.”
Water Footprint: Water and land use put chocolate near the top of the list of harmful food products. For example, “The water footprint of chocolate is about 24,000 liters per kilogram of chocolate.” (OGP) That’s almost 8500 more liters than it takes to produce a kilogram of beef. (WFP) Another study puts it at 17196 litre/kg. (AYH).
Land Use/Destruction/Deforestation: Cultivating cocoa for chocolate creates a monoculture which damages long-term sustainable land use. Sugar from cane is a main ingredient in most chocolates, and that is also cultivated in tropical climates.
Moreover, cocoa farming has increased with slash and burn and clear-cutting of hundreds of thousands of acres of land across the planet. Slashing and burning leads to large amounts of GHG being released into the atmosphere. (ibid)
Chemical Pollution output: To grow cocoa, “…soils must be well aerated, and pests and diseases must be carefully controlled.”
So pesticides and fungicides are used in large quantities, “The inevitable problems of pests, diseases and loss of soil fertility monoculture causes are being dealt with by the use of lots of chemical herbicides, pesticides and fungicides – all very bad for the health of the land, water and local people…Ultimately it is not sustainable and the ecosystems of the plantations will collapse leaving a desert.”
As the land is degraded, it requires the use of more fertilizer that further pollutes and degrades the land. After a few growing seasons, the soil is bleached of nutrients, “…the soil quickly becomes degraded and the lifespan of plants can be cut from 75 or 100 years, to 30 or less. When the trees die and the land is exhausted the farmers must move on and clear more rainforest to plant cocoa...Intensively farmed landscapes need a lot of inputs -- such as water and chemical fertilizers - and their fertility tends to degrade rapidly.” It is a viscous cycle of slashing, burning, growing, moving, slashing, burning, growing and so on.

3. Palm oil
Carbon footprint: The carbon footprint of palm oil cultivation is due mainly to deforestation of rainforests, “When tropical forests are cleared to make way for oil palm plantations, carbon is released into the atmosphere as carbon dioxide (CO2), the gas that is the leading cause of global warming; tropical deforestation accounts for about 10 percent of total global warming emissions (UCS 2013).”
And as is with cocoa, the deforestation for planting palms in tropical forests reduces global carbon sequestration. In fact, “Indonesia was the world’s seventh-largest emitter of global warming pollution in 2009, and deforestation accounted for about 30 percent of these emissions (WRI 2013)…that same year Indonesia ranked second (behind Brazil) in the amount of global warming pollution...because of deforestation (WRI 2013).” (ibid) Also, destroying peat lands in South East Asia for palm oil production is releasing carbon into the atmosphere and reducing the capacity of the soil as a carbon sink.
A Stanford and Yale study found that an increase in palm plantations “...will add more than 558 million metric tons of carbon dioxide into the atmosphere by 2020 — an amount greater than all of Canada’s current fossil fuel emissions.”
Methane Footprint: Waste water methane is a major GHG emission from palm oil production, “...the journal Nature Climate Change revealed that the wastewater produced during the palm oil production process is a significant source of heat-trapping methane in the atmosphere… roughly equivalent to the emissions from 22,000 passenger vehicles.”
Water Footprint: 853 cubic meters of water is needed to produce a ton of palm oil, but less than rice (3473), Soybeans (1958) or Corn (2483). However, much of the water is turned into methane rich sludge, as previously mentioned.

Land Use/Destruction/Deforestation: Studies estimate that around 50% of the product we consume each day, food, body products and household item, contain palm oil.
The ever expanding land use for palm oil and related palm products puts palm oil squarely on the list of harmful products for the sustainability of the planet. In fact, “About 40 millions tons of palm oil, which is considered the cheapest cooking oil in the world, is produced each year, and 85 percent of it comes from Indonesia and Malaysia. In these countries, 30 square miles of forests are felled daily, and palm oil plantations account for the highest rates of deforestation in the world. (MNN) When the rain forests disappear, so does almost all of the wildlife, including orangutans, tigers, bears and other endangered species.”
The land use for palm oil has increased over 250% since 1990, “Palm oil acreage worldwide increased from 15 million acres in 1990 to 40 million acres in 2011. Much of this new palm oil acreage is coming at the expense of tropical forests.”
Chemical Pollution output: Like cocoa, palm plantations utilize large amounts of chemical inputs, “Pesticide use on the massive palm oil plantations throughout Asia and the Pacific is putting the health of communities and agricultural workers at risk.”
Even banned chemicals are used, while “…the world have banned pesticides that are internationally recognized as harmful to human health, use of these same pesticides has increased in Asia. In fact, agricultural pesticide use in Asia accounts for 30% of global pesticide consumption.” This list of dangerous pesticides includes paraquat, which will kill if ingested, and whose use is linked to organ failure and cancer. (ibid)
As nations are banning paraquat (a dangerous, poisonous pesticide), glyphosate, a Monsanto product, is taking its place. Glyphosate has been know to contaminate soil and causes health problems.

4. Sheep/Lamb
Carbon footprint: Lamb production produced 39.2 kg of greenhouse gases for one kilogram of meat. (HuffPo) This is 12.2 kg more carbon per kg of cow. However, there about 430 lb. of retail cuts (195 kg) of meat from one cow and around 41 kg of meat from one lamb, on average.
There are more sheep than any other ruminant on the planet, “With estimated standing populations of 1.43 billion cattle, 1.87 billion sheep and goats, 0.98 billion pigs, and 19.60 billion chickens, reliable and accessible information on the distribution and abundance of livestock is needed for a many reasons.”
Review sheep meat and wool numbers
Even if all the sheep were for meat only, cow carbon production for meat would surpass lamb by millions of kilos. Still, that’s lots of sheep and goats, and they produce carbon at the highest per pound rate and also belch methane.
Methane Footprint: Sheep release about 30 liters of methane each day, a dairy cow up to about 200 (GHGO), mainly from belching. Like cattle, sheep also produce methane from manure, only in smaller amounts.
Water Footprint: About 1 kg of meat from lamb requires approximately 6000 liters of water use. (AYH) That is much less than beef and far below chocolate. Another study says that lamb uses 5521 litre/kg, still a huge number compared to other food products. (WFPG)
Land Use/Destruction/Deforestation: Livestock account for about 30% of the world’s land use. Much of that land was originally forested and was clear cut or slashed and burned for livestock. Of course, most of that land is for cattle (80%), but sheep (10%) also have a role all over the world. (ibid).
That means 3% of the global land area is used for sheep farming. That makes it less damaging than cattle, but sheep is number two in land use of all livestock. One positive environmental factor for sheep and lamb is that they can live off more marginal land than cattle; they are less demanding of land that can be used to grow crops.
Chemical Pollution output: Sheep mainly eat alfalfa and legumes such as peas. And growing legumes fixes nitrogen, food for other plants, into your soil. Thus, growing feed for sheep can be a net gain in land fertility. Compared to the corn chickens, pigs and cows eat, this is a better, more sustainable feed crop with fewer pesticides and herbicides used.

5. Sugar
Land Use/Destruction/Deforestation: The land use issues of sugar production puts it at number five on the list, “One extreme example of environmental destruction by the sugar industry is the Great Barrier Reef off the coast of Australia. Waters around the reef suffer from large quantities of effluents, pesticides and sediment from sugar farms, and the reef itself is threatened by the clearing of land, which has destroyed the wetlands that are an integral part of the reefs ecology. In Papua New Guinea, soil fertility has declined by about 40 percent over the last three decades in heavy sugar cane cultivation regions.”
And, for each hectare of land use for sugar plantations, an estimated 15 to 500 tons of soil is lost. That alone puts sugar on the list.
Carbon footprint: For sugar cane production: “According to our calculations, 241 kg of carbon dioxide equivalent were released to the atmosphere per a ton of sugar produced (2406 kg of carbon dioxide equivalent per a hectare of the cropped area, and 26.5 kg of carbon dioxide equivalent per a ton of sugarcane processed). The major part of the total emission (44%) resulted from residues burning; about 20% resulted from the use of synthetic fertilizers, and about 18% from fossil fuel combustion.”
Another average estimate is “2kg per kg of white sugar.” And with about 180 million tons of sugar produced each year, carbon output adds up.
 from sugar plantations")
Methane Footprint: It is hard to find data for sugar methane output, but burning of rainforests and water waste certainly add to the methane emissions. And like palm oil and cocoa cultivation, deforestation increases the the release of CO2 into the atmosphere.
Water Footprint: Beet sugar, uses 920 liters per kg (WFPG), Cane sugar, which is about 70% of the world’s production, 1782 liters per kg, nearly twice as much. Sugar cane cultivation for 1 kg uses 1500 liters of water. (WFG) Sources vary, but considering the number of products that contain sugar, the water use adds up.
Chemical Pollution output: Today, 121 countries produce about 145 million tons of sugar every year (180 tons including beet sugar) according to the World Wildlife Fund study on sugar production. This reduces world biodiversity by destroying habitats and damages watersheds through the use of pesticides. In fact, “Thousands of acres of the Florida Everglades have been compromised after years of sugar cane farming — subtropical forests became lifeless marshland after excessive fertilizer runoff and irrigation drainage.”

6. Coffee
Carbon footprint: Much of the carbon footprint of coffee is in the transportation and sale of the product, “Of the 10 to 11 pounds of carbon emissions that the average pound of coffee creates, as much as 50% is created at the retail and consumer level.”
And “In terms of footprint throughout the whole coffee value chain from bean to cup, the full carbon footprint including these various different processes reaches 59.12 g CO2e per cup of coffee (PCF Pilotprojekt Deutschland, 2008). (BALAS)
At the farm level, 95% of the carbon emissions, 0.96 kg, is due to the use of fertilizers. (BALAS)
Decomposition is the top of the waste level CO2 emissions of waste at 0.512 kg, 80% and fossil fuel use 10% or 0.097 kg (BALAS)
Smaller areas of emissions include transportation, roasting and packaging including point of sale at 0.27 and 3.05 C02 per kg respectively. The total carbon footprint for 1 kg of coffee totals 4.98 kg C02. (ibid)
Methane Footprint: Studies I found on coffee GHG emissions doesn’t disaggregate carbon output from methane output.
Water Footprint: About 18,900 liters of water are needed to produce 1 kg of roasted coffee. (WPFG) To produce 1 cup of Coffee you use 30 gallons of water. (SOY) That is an outrageous amount of water.
Land Use/Destruction/Deforestation: Overall, “…coffee is grown on more than 10 million hectares worldwide.” (BALAS 1) Sun grown coffee, which has a short-term spike in productivity on the land then a dip, requires deforestation and lots of chemical inputs. (ibid) Growing sun coffee “…requires the application of large amounts of fertilizer and pesticides, and it depletes soils through erosion and the sapping of nutrients — all things that damage intricate tropical ecosystems.” Overall, the demand for more coffee is severely damaging the rainforests and thus increasing GHG in the atmosphere that lead to climate change.
Chemical Pollution output: Land use issues occur with coffee like other tropical zone crops, “Deforestation trends are serious throughout the coffee producing lands of Latin America and remarkable biodiversity values are at stake. Latin America’s tropical forests are critical ecologically for purposes of protection of atmospheric dynamics, water quality, wildlife species, as well as economically.”
Water pollution occurs from coffee processing, “Contamination of waterways also pose serious environmental threats from the processing of coffee beans. Largely irrespective of how coffee is grown, discharges from coffee processing plants represent a major source of river pollution...robbing aquatic plants and wildlife of essential oxygen.” (ibid)
Moreover, sun-cultivated coffee employs intensive pesticides and chemicals that present serious health and ecological concerns. The World Resources Institute (WRI) carried out a recent study that reported extensive human exposure to pesticides in Latin America and elsewhere in the developing world. They found that, “The correlation between increased nitrogen fertilizer application and the widespread removal of shade cover from Central American coffee plantations is evident, with these heavy synthetic fertilizer inputs contributing to increasing contamination of waterways and aquifers.” (ibid)
7. Soybeans
Carbon footprint: Tofu and soy milk are two products with carbon data, “Total for one pound of organic tofu: .857 pounds CO2 equivalent” per pound of tofu. That’s a pittance compared to a pound of beef.
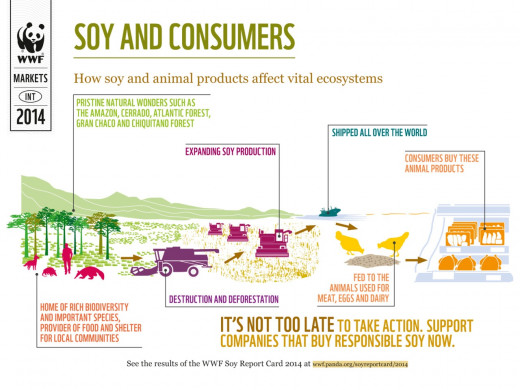
According to the website, gentleworld.org, ““About 85 percent of the world’s soybean crop is processed into meal and vegetable oil, and virtually all of that meal is used in animal feed. Some two percent of the soybean meal is further processed into soy flours and proteins for food use… Approximately six percent of soybeans are used directly as human food, mostly in Asia.””
If we were to stop feeding soy to animals, much of the impact soybeans have on the environment would be eliminated. But that is not the reality of today.
Methane Footprint: See sugar.
Water Footprint: From planting to processing, 1 gallon of Soy Milk needs 49.4 gallons of water (SOY) and 1 pound of Tofu uses 244 gallons of water (SOY).
Land Use/Destruction/Deforestation: This is why the soybean is on the list. In Central America alone, “Between 2004 and 2005 an estimated 1.2 million hectares of rainforest was cut down as a result of soybean expansion.” (FAOA)
The growing of soybeans threatens wildlife and biodiversity. This leads to a release in GHG and damages soils and water sheds. In South American, about 4 million hectares of land is lost each year to grow soybeans.
Chemical Pollution/pesticides/herbicides: Chemicals from agriculture are used on soybean farms to increase productivity, however, “These chemicals are a major source of nutrient pollution in rivers, lakes and estuaries. Additionally, unsustainable water use in irrigated systems can strain aquifers, such as the Ogallala Aquifer in North America and the Guarani Aquifer in South America.”

8. Rice
Carbon footprint: 8.3 Million Metric Tons of C02 are produced for 332 kilotons cultivated in 2013.
Methane Footprint: Rice cultivation accounts for 9% of the world’s methane emissions. (WYI) Moreover, “At between 50 and 100 million tonnes of methane a year, rice agriculture is a big source of atmospheric methane, possibly the biggest of man-made methane sources.” That is why rice is on the list.
Water Footprint: Rice cultivation requires 2497 liters of water per kg. (WFPG) About 592 billion kg of rice are produced each year, and that means a whopping 1.5 quadrillion liters of water used for rice cultivation each year. Others estimates tell us that 3,400 liters of water are need for 1 kg (WFP) or 2.2 pounds of rice uses 748 gallons of water (SOY).
Land Use/Destruction/Deforestation: 132 million hectares are used to cultivate rice for the world. (RICE) There are 5,905,172,890 hectares of arable land on the planet and 2.2% of that is cultivated with rice. (RICE) Rice cultivation in the U.S. alone used 1,132,476 hectares of land. (EPA Ag)
Chemical Pollution output: Rice cultivation contaminates waterways around the world, “Rice is the major calorie source for half of the world’s population, but growing rice accounts for one-third of the planet’s annual freshwater use, according to Oxfam.” However, there are new methods of growing rice that could reduce use by up to 25%. (ibid)
Perhaps rice could be higher on the list. However, it is not wasted feeding animals like corn and soy and is not use to produce thousands of food and non food items like palm oil. While rice uses lots of water, it can be grown outside the tropics and thus leads to less deforestation.
.")
9. Corn
Carbon footprint: Another high-intensity crop grown around the world, and like soy, is used extensively for animal feed. It has a relatively high carbon footprint, “West and Marland (2002) reported estimates for C emissions from agricultural machinery, averaged over maize, soybean and wheat crops in the USA at 69.0, 42.2, and 23.3 kg C ha␣1 per year for conventional tillage, reduced tillage and zero tillage respectively.”
One reason corn has a higher carbon footprint than other grains is that it is more heavily fertilized and heavily tilled than wheat and soy. The more fertilizer used, the more a crop is tilled, the higher the carbon footprint.
Methane Footprint: See sugar
Water Footprint: 1 pound of Corn uses 109 gallons of water. (SOY) Not so bad, that. And that is one reason why corn is only nine on the list.
Land Use/Destruction/Deforestation: It is found everywhere, and “…overproduced due to government subsidies and thus, is grown across about 97 million acres of land in the United States alone…” Because it is grown in large monocultures, it is susceptible to pests and thus needs a lot of pesticide and herbicides. (ibid)
Additionally, “over six million tons of nitrogen is used on corn through chemical fertilizers and manure…” (ibid) The cornfields in the U.S. also consume “over six billion gallons of freshwater each year in the United States…” and one acres of corn cultivation uses “…approximately 60 gallons of fossil fuels for production and distribution.” Still, that's relatively low water use for major food staple. Biofuels from corn wastes millions of pounds of the crop every year that could be used to feed people.
Because thrives in temperate climates, direct destruction of the rainforest is not part of corn's ecological impact as it is for soy, palm and cocoa.
Chemical Pollution output: One problem is that GMO seeds and pesticides have created pests that are chemical resistant. That increases the use of other, stronger pesticides. That is the case with GMO corn in the United States.
Runoff from corn has polluted watersheds across the nation, “The primary driver of Lake Erie’s toxic algae (and similar blooms elsewhere in the Great Lakes and across the nation) is the same driver of dead zones in Lake Erie, the Gulf of Mexico and the Chesapeake Bay: excess nitrogen and phosphorus runoff into our waterways.”
Algae in lakes depletes the oxygen and kills fish and other aquatic life and the fauna up the food chain that relies on these animals for their survival.

10. Chickens
By around 2010, chickens became the most popular meat in the world with more people eating it than beef. (http://www.huffingtonpost.com/2014/01/02/chicken-vs-beef_n_4525366.html)
People are eating more chicken “for their health”, but at these quantities, it is damaging to the environment, “The poultry industry is a major cause of environmental degradation in the United States.” The sheer number of chickens makes this a danger to the environment.
For example, “U.S. chicken producers use a total of 2.2 million pounds of the antibiotic arsenic compound roxarsone each year. More than 95 percent of the roxarsone fed to chickens is excreted in chicken waste” and the chicken manure is full of arsenic, a known carcinogen, found in the chicken feed and antibiotics fed the chickens. (ibid)
One poultry researcher states, "The amount of animal wastes produced in the U.S. is staggering. In chickens, for example, the daily production of wastes is essentially equal to the amount of feed used. This means for every truckload of feed that is brought onto the farm, a similar load of waste must be removed. A one million hen complex, for example, produces 125 tons of wet manure a day" (Bell 26) What’s worse is that “…Poultry manure contains large amounts of nitrogen, phosphorous, and potassium.” (ibid) Like corn runoff, the run off from poultry farms deoxygenates lakes, killing the capacity of of these lakes to support life.
Carbon footprint: As with cows, the feed production for chicken is a major environmental hazard, for it "makes up 57 percent of emissions, with an additional 18 percent related to LUC caused by crop expansion (Figure 28). Feed N2O emissions are caused by fertilization (both synthetic fertilizers and manure); whereas feed CO2 emissions arise from fertilizer production, use of machinery in field operations, transport and processing of crops, feed blending and production of non-crop feed materials i.e. fishmeal, lime and synthetic additives." (FAOC)
Emissions related to manure storage and processing represent the next largest category of emissions, at 11 percent, followed by postfarm emissions and on-farm energy use, predominantly arising from broiler production.” (ibid)
Methane Footprint: It is negligible compared to cattle and sheep. “From McNuggets to a cordon bleu, chicken in all of its parts make up roughly one-third of the world's meat intake. Coupled with 6.9 kg of greenhouse gases for every kg of chicken consumed, and this bird's impact on the environment starts adding up.” (HuffPo)
Water Footprint: 4325 liters per kg of chicken. (WFPG) 1 pound of Chicken uses 469 gallons of water (SOY)
Land Use/Destruction/Deforestation: Chemicals from poultry farms and the chicken waste make the land in and around the area unusable. Total land use is relatively minor, however, “Each year, the U.S. raises roughly 8.54 billion chickens for meat. Nearly all meat chickens are raised in factory farms, where they live in large sheds containing 20,000 chickens or more. The chickens live crammed together on the shed floor, which is covered in litter (a shredded, absorbent material). Because they live in their own waste, high ammonia levels irritate and burn their eyes, throats and skin.”
Chemical Pollution output: The FDA tells us that 70% of our chicken contains arsenic from feed and antibiotics containing the poison. Other antibiotics are used in chickens to improve production. It is unclear whether the build up of antibiotics in chickens can harm humans. One major problem with the spread of disease in chicken populations is the high density pens chickens live in, and the density has only increased.
Of course, a close runner up to chickens is the pig, “In the study, pork, poultry, dairy and eggs all had comparable environmental footprints, so close there were no statistically significant differences among them, Eshel said. But cows were off-the-chart different."
The fact that pigs will eat anything and produce proteins, and there are fewer of them per pound on the planet, puts them at number 11. However, it takes less feed to grow a chicken, so perhaps switch these two. However, we eat on average about 17 more pounds of chicken a year than pork, so I put chicken at 10. The point is, a lot depends on how the meat is grown, treated, and how you treat the waste. Clearly, beef and lamb meat are not choices for a sustainable planet.

Links:
Carbon footprint:
(BALAS) http://www.balas.org/BALAS_2013_proceedings_data/data/documents/p639212.pdf
(Huffpo) http://www.huffingtonpost.ca/2012/04/05/earth-day-2012-the-most-harmful-foods_n_1402771.html
(FAOC) http://www.fao.org/3/a-i3460e.pdf
(MEG) http://www.ewg.org/meateatersguide/a-meat-eaters-guide-to-climate-change-health-what-you-eat-matters/climate-and-environmental-impacts/
(GE) http://www.greeneatz.com/foods-carbon-footprint.html
(OGP) http://www.onegreenplanet.org/animalsandnature/most-environmentally-destructive-foods/
(TFC) http://timeforchange.org/eat-less-meat-co2-emission-of-food
Methane Footprint:
“Methane (CH4) is the second most prevalent greenhouse gas emitted in the United States from human activities. In 2013, CH4 accounted for about 10% of all U.S. greenhouse gas emissions from human activities. Methane is emitted by natural sources such as wetlands, as well as human activities such as leakage from natural gas systems and the raising of livestock. Natural processes in soil and chemical reactions in the atmosphere help remove CH4 from the atmosphere. Methane's lifetime in the atmosphere is much shorter than carbon dioxide (CO2), but CH4 is more efficient at trapping radiation than CO2. Pound for pound, the comparative impact of CH4 on climate change is 25 times greater than CO2 over a 100-year period.”
http://epa.gov/climatechange/ghgemissions/gases/ch4.html
(HBYU) http://hccmpw.org.uk/medialibrary/publications/Reducing%20Methane.pdf
(EPA Ag) http://epa.gov/climatechange/ghgemissions/gases/ch4.html
(EPA Ag 2) http://epa.gov/climatechange/Downloads/ghgemissions/US-GHG-Inventory-2015-Annex-1-Key-Category-Analysis.pdf
(WYI) “Since the Industrial Revolution, human sources of methane emissions have been growing. Human activities such as fossil fuel production and intensive livestock farming are the primary cause of the increased methane concentrations in the atmosphere. Together these two sources are responsible for 60% of all human methane emissions. Other sources include landfills and waste (16%), biomass burning (11%), rice agriculture (9%) as well as biofuels (4%).1 http://whatsyourimpact.org/greenhouse-gases/methane-sources
(GHGO) Ruminants: http://www.ghgonline.org/methaneruminants.htm
Water footprint:
(WFPG) http://waterfootprint.org/en/resources/interactive-tools/product-gallery/
(WPF) http://waterfootprint.org/media/downloads/Hoekstra-2008-WaterfootprintFood.pdf
(WPFR) http://waterfootprint.org/media/downloads/Chapagain-Hoekstra-2011-waterfootprint-rice_1.pdf
(AYH) http://www.ayhoekstra.nl/pubs/Hoekstra-2010-TheEnvironmentalist-01March-Issue93.pdf
(SOY) http://waterprint.net/list_all.html
Land Use:
(EPA Ag) http://epa.gov/climatechange/Downloads/ghgemissions/US-GHG-Inventory-2015-Chapter-5-Agriculture.pdf
(RICE) http://www.rac.es/ficheros/doc/00740.pdf
(EDL) http://everydaylife.globalpost.com/much-earths-land-farmable-39677.html
1/3 of the planet’s surface is used for agriculture. (SS) http://www.slideshare.net/judyliew/agriculture-studies-unit-10
(FAOA) http://www.fao.org/agriculture/lead/themes0/deforestation/en/
(MNN) http://www.mnn.com/food/healthy-eating/photos/12-foods-that-are-bad-for-the-planet/foods-that-contain-palm-oil#ixzz3bwOzTqEd
Peace,
Tex Shelters