2012 Independence Day Flap Not a True UFO Storm

True UFO Storm or Artifact?
As I mentioned in my last hub, when compared to a typical month of June, June of 2012 was an exceptional one (gleaning 1.8Xs more sightings than for the average June when looking at the previous decade). Not only was it the June with the highest number of UFO reports recorded by NUFORC, but it was also the third highest of any monthly total since Peter Davenport took over as director there in the fall of 1994.
I expect the following summer months to also be big when it comes to the UFO numbers and, not surprisingly, on this last July 4th, there were many more U.S. sightings in the four hour period from 8pm to midnight (local time) than your typical summer night would bring. The 4th of July has actually shown significantly higher numbers than the average daily figures for the last few years, especially the one in 2010 (July of that year surpasses all monthly sighting records kept at NUFORC). I believe that most of the reason for this Independence Day effect is due to the fact that many people are outside in the evening hours on that day many more times than on a typical summer day.
Most sightings during a typical July tend to occur between 8pm and midnight (at least there were 3.7Xs more per hour within that time period than was the case for the per hour rate during the 20 hours before it in July 1952, when the U.S. was experiencing a UFO wave). July 4th of 2012 had most of the sightings occurring between 8pm and midnight also. If you compare a four hour period from 8pm to midnight (local time) in the U.S. for July 1952 and July 4th, 2012, you find a stark contrast between the two. The hourly rate on 7/4/12 for the 8pm to midnight period was 57Xs greater than the hourly rate outside of that range. Based on the rates inside and out of the peak four hour period back in 1952, there should have been only 1.5 sightings per hour during the most intense phase on 7/4/12; instead it came out to over 15 times that.
In other words, of the 152 reports studied for July 1952 (using Larry Hatch's *U* UFO Database), 43% of them (65) fell within the 8pm to midnight hours or 16.25 per hour (and 4.35 per hour during the preceding 20 hours) while, during July 4, 2012, there were 91 reports (mostly originating from MUFON but filtered by sightingsreport.com) in the four hours just before midnight (22.75 per hour) and only 8 reports for the 20 hours before that (or 0.4 per hour).
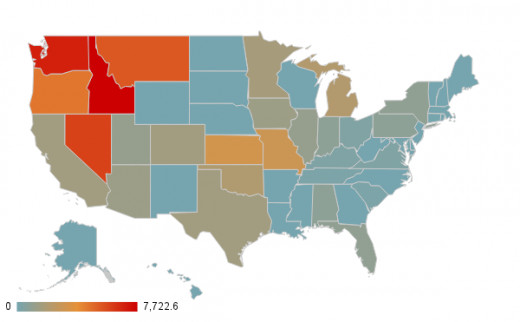
Also of note is the fact that Washington state had 40Xs more sightings on July 4th than the daily average from the month before (based on raw data for both) and 30xs more close encounter sightings on July 4th than the daily average in the month just before (again based on raw data). Oregon, the only other state out of the top five that gives anywhere near reliable results (statistically speaking, due to a fairly large population and sighting figures), had 10Xs more sightings and 7.5Xs more close encounters than the daily average for the month prior.
As a side note, of the 130 raw reports from MUFON for July 4, 2012, 11.5 % were close encounters. This is compared to 17.8% close encounters (within 500 feet of the witness) for the previous month. All of the above factors, for me at least, implicates that the increase in June 2012 was akin to a wave or due to a real increase in true UFOs whereas the increase on July 4th was mostly an artifact of the greater witness numbers.
It can be mentioned here that I have found a parallel with an increase in UFO sightings and solar minimum. July 4th also falls very close to when our planet is at its furthest point away from the sun in its orbit. And the evening hours also experience the weakest solar radiation hitting the earth. We are presently not in a period of solar minimum, but the other two factors I feel contributed to the higher numbers.
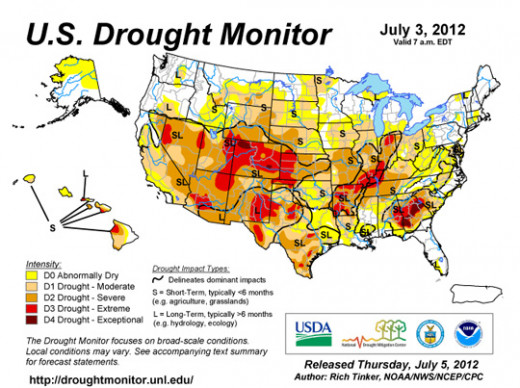
Looking at the Sighting report intensity map at the top of this hub, based on raw numbers from MUFON for July 4, 2012, one sees a patch of the U.S. in the northwest that experienced a high intensity of UFO sightings (when population density is factored in). Part of the reason for this increase may be due to the fact that most of this area of the US was not severely impacted by drought conditions (see US map indicating areas of drought below), especially in the state of Washington, which also has very liberal fireworks laws. That state and Oregon, have the most reliable data due to their larger population density figures and sighting numbers than the other three of the top five states. Since Washington state's fireworks laws are much less restrictive than those in Oregon, I find it not too surprising that (as stated earlier) Washington had 40Xs more sightings while Oregon had 10Xs more than would be expected based on the average daily number in June 2012. It should also be stressed that 92% of the sightings for July 4th, 2012 occurred during the four hours just before midnight (local time). Further, based on July sightings in the past, the number of sightings considered here were between 15 and 20Xs greater than normal on 7/4/12 during those four hours in the U.S.
There were few if any government officials calling off fireworks due to fire conditions in most of this area so there were more people showing up for such shows per capita in Washington state than perhaps anywhere in the U.S. There may also have been more pranksters lofting Chinese lanterns into the sky there on this date as well since, as water logged as it was from rains the month prior, there was little worry that any fires would be sparked due to such mischief. Another factor to consider is that MUFON usually doesn't show Washington state in the top five states for reports (again when considering population density), but this time it came in at least in 2nd place (Idaho was first but its figures are less reliable due to a much smaller population and UFO report numbers from there). Washington was in 10th place for my breakdown of states for June 2012 (using MUFON and NUFORC, the later source usually showing significantly more reports for that state than with the former one).
Interestingly, July 4, 2010 was a bigger day for UFO sightings than July 4, 2012, even though June 2012 had 1.7Xs more sightings than was the case in June 2010 (averaging MUFON and NUFORC data). I believe the reason for that is because two years ago there was less of a fire hazard and thus there weren't a large number of public fireworks being called off as was the case this year. Regardless of whether July 4, 2012 was a UFO storm or not, at the very least it, due to the large number of data for a single day, allowed us to get a snapshot with some degree of accuracy for a moment in time.
© 2012 Joseph Ritrovato
")