Colorado Leads Arizona 2 to 1 in June 7-9 UFO Contest
In my last hub I zeroed in on a period of 4 days in late May 2012, where UFOs in the Close Encounter category were at their most intense in the United States. They were at a level of 2.2Xs greater than usual (based on filtered data) when compared to the full 28 day period reviewed (5/6-6/2/12). There was a similar span of 3 days in June 2012 (6/7-6/9/12) where Close Encounters (CEs) were at 1.9Xs greater than usual (based on raw data) for another 28 day period (6/3-6/30/12). Similar to the 2 daytime CEs that occurred on May 29th (or the last day of the 4 day concentration of CEs at the time), there was a daytime CE on each one of the three 3 day concentration of CEs from June 7th to June 9th. Since UFO activity was already at a high level for the days surrounding these bursts of CEs, the concentrations of activity actually represent levels more like 3Xs that of normal. I now present my second study related to current high concentrations of Close Encounter activity in the U.S.
Most Ufologists will tell you that out of the hundreds of UFO sightings that are reported each month, usually only as little as 4% are inexplicable, true UFOs, or the polar opposite of IFOs (Identified Flying Objects). While I believe that figure is true during months of lowest activity, it is my belief that the percentage rises as the number of reports increases. During an average month I would guestimate (or make an educated stab at a figure) that 7-12% of reports are ones that Blue Book would have eventually labeled an "Unknown". In wave or flap periods, where sightings are in concentrations of 2-3Xs that of normal however, I feel that the percentage of Unknowns can rise to a level of 20-30% of the total. Perhaps even as high as 40% as a former director of Blue Book once stated it did during the summertime UFO wave of 1952.
In my last study of CE concentrations I filtered out a large chunk of reports so that about 75% of the raw data was used. This time I read each report and rejected a good deal more, leaving just 37.5% of the reports to use for analysis.. One reason such a big chunk was thrown out was that I decided to add rather than average the NUFORC (National UFO Reporting Center) data (15 out of 62 reports or 24%) with MUFON's (Mutual UFO Network's)(36 out of 74 reports or 49%). Since I was now adding rather than averaging I took great care to remove duplicates or sightings that had been reported to both agencies (part of the reason why so many more sightings were rejected with NUFORC).
The Close Encounter reports used (within 500 feet of the witness), only categorized as such by MUFON, represented only about half of the MUFON total (8 out of 15) for the 3 day period studied. Of the 8 CEs used during those 3 days, there were 3 that occurred during the day or a staggering 37.5%, which also represents 4.7Xs the average for a 3 day period within the full 28 days reviewed (the 3 such reports during those 3 days represented half of the 6 filtered daylight CEs during the 28 day period from 6/3-6/30/12).
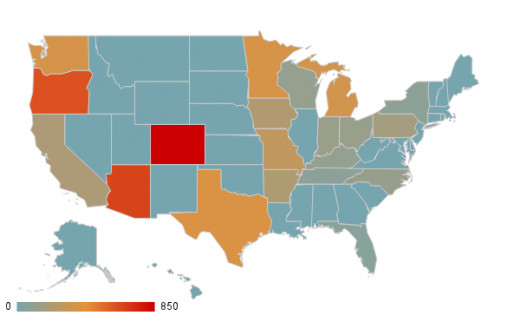
In other words, something extraordinary was occurring during those three days in June and I set out to try to get as clear a picture of the situation as I could. I plan to give more details related to the individual reports during this period in a later hub but, for now, will only be looking at the numbers and how they have been used to rank the U.S. states (in the spreadsheet below) and how that looks mapped out (shown above).
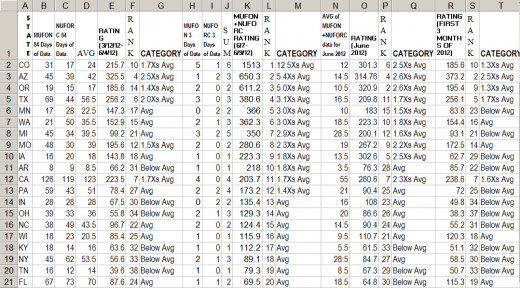
Whereas Missouri and Virginia hosted the only daytime CEs for the 28 day period from 5/6-6/2/12 (both on 5/29 during the last day of the 4 days where CEs dominated), Colorado, Michigan, and Pennsylvania was home to them during the three days of heightened CE activity from 6/7-6/9/12 (3 others occurred in North Carolina on 6/3, New York on 6/15, and Oklahoma on 6/22). When compared to the previous CE storm in late May, Nebraska and Montana fell from their dominant positions (of 1st and 2nd place) to a no report showing status. Similarly Utah and New Mexico (in 6th and 7th place before) dropped out of the picture. Colorado and Oregon maintained a high position (they were in 5th and 4th place before). Arizona, Texas, Minnesota, Washington, Arkansas, Pennsylvania, and Indiana graduated to significantly higher levels during the June CE storm. Missouri moved down a bit from the number 3 position to the 8th. Michigan, Iowa, California remained in a zone of strength (was 8-13, now 7-11). During the 3 day June storm, the 36 filtered MUFON sightings were concentrated in 18 states while the 4 day May storm with 59 filtered MUFON sightings reports were spread out over 32 states. Although NUFORC's 15 filtered reports during the June storm represented 29.4% of the total used here they played an important role. Minnesota didn't have any filtered MUFON reports, but NUFORC had 2 credible ones resulting in it being ranked in 5th place (having a population density of around 33% less than the U.S. state average made a difference also since that entered into my rating formula). The NUFORC data also ended up tripling Arizona's report numbers, doubling Pennsylvania's, and increasing Michigan's by 67%, effectively advancing the standings of those states substantially.
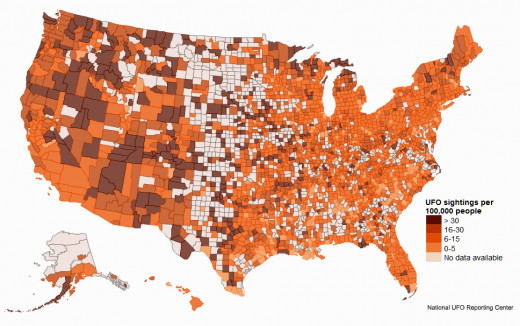
I leave you with a graphic map display that depicts UFO sighting concentration numbers (NUFORC reports per 100,000 population) by individual U.S. state counties for 15.5 years from 1995.0 to 2010.5. I've modified the colors and contrast of the original image to enhance the county borders and shadings that represent the different concentrations.
Related Link (my hub just prior to this one)
- Chasing UFOs? Current Hotspots and Daily Trends for Close Encounters Examined
Analysis of where and when UFO sightings appeared in the US for the period from May 6th to June 2nd, 2012. Examining the better reports from MUFON and NUFORC for those 28 days and also investigate a 4 day period of increase Close Encounter activity.
© 2012 Joseph Ritrovato

