ArtsAutosBooksBusinessEducationEntertainmentFamilyFashionFoodGamesGenderHealthHolidaysHomeHubPagesPersonal FinancePetsPoliticsReligionSportsTechnologyTravel

Further Review of UFO Activity for the Start of 2013
Updated on March 14, 2013
retrojoe profile image

MUFON UFO Journal author (March 1995, June 1996). Self published on UFO Window website from 1997 to 2002. Hubpages articles began late 2011.

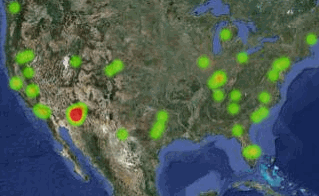
UFO Heat Map (produced at sightingsreport.com) displaying sightings concentrations for January 14-16, 2013.
UFO Heat Map (produced at sightingsreport.com) displaying sightings concentrations for January 14-16, 2013. | Source

As mentioned in my last UFO hub, UFO sightings took a nose dive in regards to the number of events submitted to the reporting agencies early this year after 18 months of steady and significant increases. Unfortunately, the numbers out of the National UFO Reporting Center in the state of Washington show what appears to be a large chunk of missing data during at least the first month of 2013. However, during this same period, the numbers coming out of the Mutual UFO Network appear more consistent with what would be expected when dealing with the complete picture (more on this at the end of this hub).

In this second part examining this phase of recent UFO activity, I decided to test an hypothesis of mine. I have created a formula to help identify the occurrence of a UFO flap (period of increased UFO activity covering a few days in time and often confined to a small geographic area). After the results for a given month are in, I determine the average daily frequency of reports for that month and use that as a bar or threshold that reports must meet or exceed to qualify for a flap day. If they pass step 1 in the assessment then they need to pass the close encounter and daylight sighting percentage test. If they have at least 10% of each for a given day that becomes a flap day. In the future I may make exceptions for those that come close to qualifying if other criteria are met but that was not the case this time.

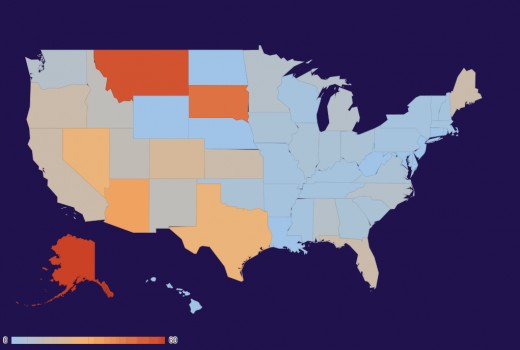
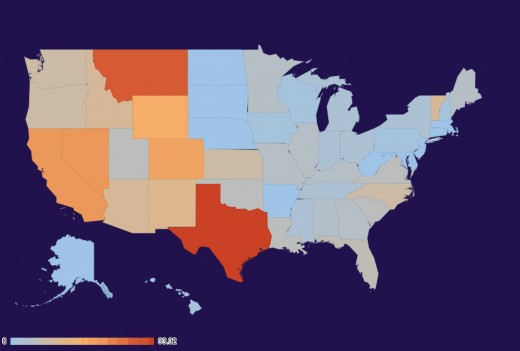
What arose from this scrutiny of reporting days for UFOs in the first two months of 2013 was that there were 10 potential flap days in January and 9 such days in February. I broke down the reports by state for this category and created distribution by state maps (utilizing population density data to weigh significance). I then did the same for the days that did not qualify and compared them for each month.
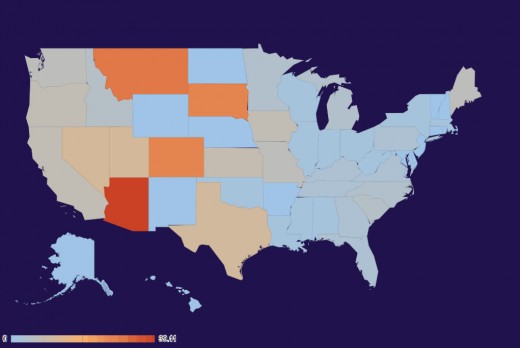
Map based on MUFON & NUFORC data for the 10 days that passed the UFO flap day test in Januaray 2013.
Map based on MUFON & NUFORC data for the 20 days that didn't pass the UFO flap day test in Januaray 2013.

For January, two states, Montana and South Dakota stood out strongly for both the dates that passed the flap test and those that did not. In February, Texas alone was the only one to be consistently exceptional. What these states seemed to represent in those months was longer standing increases in reports that don't really qualify as flaps.

Potential states that contained a flap that stood out in the maps based on flap pass dates were Arizona in January and Oregon in February. While the flap dates represented about 1/3rd of the total number of days in each of those months, Oregon's 9 sightings (3 from MUFON and 6 from NUFORC) fell on a flap date 2/3rds of the time (all 3 of MUFON's and half of NUFORC's). So in that case, what we found was not a true flap in Oregon but rather that that state seemed to be in line with those determined dates of significance more so than the average state. That might demonstrate that the state has more than the average number of responsible witnesses who are more inclined to come forward to file a report with less likely hoaxers.
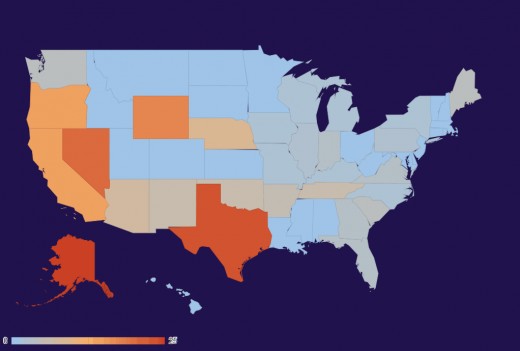
Map based on MUFON & NUFORC data for 9 days that passed the UFO day flap test in February 2013.
Map based on MUFON & NUFORC data for 19 days that did not pass the UFO day flap test in February 2013.

But in January we hit pay dirt. On January 14th through the 16th, between 7pm and 8:40pm, there was a true UFO flap experienced by many witnesses in the Phoenix area of Arizona. The last two of those three dates passed the flap day test (the other one came close). All witnesses reported glowing lights in the distance, often paired in twos (equidistant from each other and apparently connected by a structure between them), southwest of the Phoenix area. Most of the time they produced amber to orange colored light and were stationary. They could be seen for a few minutes and then fade out. Another minute or two they would reappear in a different location. They made no noise and were apparently huge.

The size assessment came from a former military person who compared their report of the 14th with someone else on the same time and day from a considerable distance away. He determined that it must be tens of miles out and thus representing very large objects. Another estimate of size that agreed with his came from a witness on the 16th of the month when the sightings, due to the lights being much closer, were a more dramatic experience.

To get a better idea of just how significant these events were, there were 20 sightings reported to MUFON over the course of those three days in Arizona and all of those were in the Phoenix metropolitan area. There were only 12 more sightings for all of Arizona for the 28 days remaining in that month (thus 62.5% of the January sightings in that state occurred in that small space and time). There were also 75 reports for all of the USA submitted to MUFON during those three days (thus more than 25% of all reports in the United States then were concentrated in that small area). Put another way, outside of the flap period Arizona had one reported UFO event every 2.3 days (or .43 per day) and inside the flap window it was 9.3 reports per day (or 21.7Xs more intense during the flap than the period outside of it).

Since proposing four cycles measured in days that can potentially produce flaps, I investigated to see if this flap aligned with a peak in any of those cycles. There was no such alignment. The only pattern that emerged was that the flap occurred just a few days before the average daily frequency of sightings dropped abruptly from 12.3 per day (for 12/1/12-1/19/13, excluding 12/31/12 & 1/1/13) to 7.8 per day (for 1/20/13-2/28/13). It was almost as if the UFOs had a soft spot for Phoenix and wanted to pay a visit before they went away for awhile.

All data= MUFON (USA only)
Daily avg for 12/1-12/30/12= 12.2
Daily avg for 1/2-1/19/13= 12.4
Daily avg for 1/20-1/31/13= 7.9
Daily avg for 2/1-2/28/13= 7.7


Copyright © 2013 Joseph W. Ritrovato

working

This website uses cookies

As a user in the EEA, your approval is needed on a few things. To provide a better website experience, hubpages.com uses cookies (and other similar technologies) and may collect, process, and share personal data. Please choose which areas of our service you consent to our doing so.

For more information on managing or withdrawing consents and how we handle data, visit our Privacy Policy at: https://corp.maven.io/privacy-policy

Show Details
Necessary
HubPages Device IDThis is used to identify particular browsers or devices when the access the service, and is used for security reasons.
LoginThis is necessary to sign in to the HubPages Service.
Google RecaptchaThis is used to prevent bots and spam. (Privacy Policy)
AkismetThis is used to detect comment spam. (Privacy Policy)
HubPages Google AnalyticsThis is used to provide data on traffic to our website, all personally identifyable data is anonymized. (Privacy Policy)
HubPages Traffic PixelThis is used to collect data on traffic to articles and other pages on our site. Unless you are signed in to a HubPages account, all personally identifiable information is anonymized.
Amazon Web ServicesThis is a cloud services platform that we used to host our service. (Privacy Policy)
CloudflareThis is a cloud CDN service that we use to efficiently deliver files required for our service to operate such as javascript, cascading style sheets, images, and videos. (Privacy Policy)
Google Hosted LibrariesJavascript software libraries such as jQuery are loaded at endpoints on the googleapis.com or gstatic.com domains, for performance and efficiency reasons. (Privacy Policy)
Features
Google Custom SearchThis is feature allows you to search the site. (Privacy Policy)
Google MapsSome articles have Google Maps embedded in them. (Privacy Policy)
Google ChartsThis is used to display charts and graphs on articles and the author center. (Privacy Policy)
Google AdSense Host APIThis service allows you to sign up for or associate a Google AdSense account with HubPages, so that you can earn money from ads on your articles. No data is shared unless you engage with this feature. (Privacy Policy)
Google YouTubeSome articles have YouTube videos embedded in them. (Privacy Policy)
VimeoSome articles have Vimeo videos embedded in them. (Privacy Policy)
PaypalThis is used for a registered author who enrolls in the HubPages Earnings program and requests to be paid via PayPal. No data is shared with Paypal unless you engage with this feature. (Privacy Policy)
Facebook LoginYou can use this to streamline signing up for, or signing in to your Hubpages account. No data is shared with Facebook unless you engage with this feature. (Privacy Policy)
MavenThis supports the Maven widget and search functionality. (Privacy Policy)
Marketing
Google AdSenseThis is an ad network. (Privacy Policy)
Google DoubleClickGoogle provides ad serving technology and runs an ad network. (Privacy Policy)
Index ExchangeThis is an ad network. (Privacy Policy)
SovrnThis is an ad network. (Privacy Policy)
Facebook AdsThis is an ad network. (Privacy Policy)
Amazon Unified Ad MarketplaceThis is an ad network. (Privacy Policy)
AppNexusThis is an ad network. (Privacy Policy)
OpenxThis is an ad network. (Privacy Policy)
Rubicon ProjectThis is an ad network. (Privacy Policy)
TripleLiftThis is an ad network. (Privacy Policy)
Say MediaWe partner with Say Media to deliver ad campaigns on our sites. (Privacy Policy)
Remarketing PixelsWe may use remarketing pixels from advertising networks such as Google AdWords, Bing Ads, and Facebook in order to advertise the HubPages Service to people that have visited our sites.
Conversion Tracking PixelsWe may use conversion tracking pixels from advertising networks such as Google AdWords, Bing Ads, and Facebook in order to identify when an advertisement has successfully resulted in the desired action, such as signing up for the HubPages Service or publishing an article on the HubPages Service.
Statistics
Author Google AnalyticsThis is used to provide traffic data and reports to the authors of articles on the HubPages Service. (Privacy Policy)
ComscoreComScore is a media measurement and analytics company providing marketing data and analytics to enterprises, media and advertising agencies, and publishers. Non-consent will result in ComScore only processing obfuscated personal data. (Privacy Policy)
Amazon Tracking PixelSome articles display amazon products as part of the Amazon Affiliate program, this pixel provides traffic statistics for those products (Privacy Policy)
ClickscoThis is a data management platform studying reader behavior (Privacy Policy)