UFO Sightings Weather Report for June 2012


As Junes go, this last one was much busier than it usually is. The number of sightings reported to the National UFO Reporting Center in Washington state turned out to be 672 (about 300 more reports than you would typically see or almost 80% more reports than normal). I have rejected 170 of those reports or about 25% to conduct the main display of information in this review. The last half of last year was significantly busier than usual, but the June just before it was normal. If this June is any indication, the last half of this year should be significantly busier than the last half of last year.
If one looks at just the close encounters (UFOs coming within 500 feet of the witness) reported to the Mutual UFO Network, the busiest 7 day period was from Wednesday June 6th to Tuesday June 12th. There were 24 of those reports out of a total of 54 such reports for the month (or 1.9Xs the statistical average). This represents 18% of the 134 raw reports for the same six day period. The 54 close encounter report tally for the month represented 10.7% of the 505 raw reports for the whole month (I rejected 110 of the original report tally or about 22% to conduct the bulk of this review). The busiest day of the week was Tuesday (14 reports), followed by Saturday in 2nd place (with 12 reports), Friday and Sunday in 3rd place (with 10 each), Wednesday in 4th (with 8) Thursday in 5th (with 6), and Monday last (with 4). Within that 7 day period was a more concentrated 5 day span of time from June 6th to June 10th with 19 close encounter reports (2.1Xs the statistical average) and, in the same period, there were 115 raw reports (1.37Xs the average).
Looking at just the raw reports, the busiest 7 day period was from Wednesday June 20th to Tuesday June 26th, with 147 such reports (with a daily average of 21 or 1.25Xs the monthly daily average). The busiest day of the month was during that week, on Saturday June 23rd, with 37 raw reports (or 2.2Xs the daily average). The average for all of the Saturdays in June 2012 is 27 or 1.6Xs the daily average for that month. When looking at the raw data figures, Tuesday is almost exactly at the daily average for the month (rather than being the most prominent as it was when looking at the close encounters).
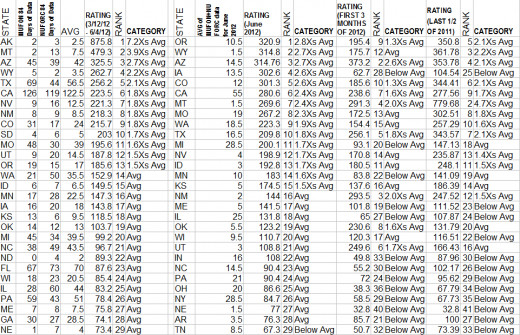
Based on an average of 448.5 sightings reports gleaned from an adjusted June tally of 502 reports from NUFORC and 395 reports from MUFON, I produced the map above showing sighting concentrations by US states. Compared to the 84 day period of 3/12/12 to 6/4/12, three states stood out as advancing significantly. Oregon jumped from 14th place to 1st, Iowa jumped from 18th to 4th, and Michigan from 21st to 11th. Wyoming and Montana, although prominently placed in the 2nd and 7th position of rank are based on a very small data set and thus may not be as reliable in their assigned status than in other states with more sightings such as Oregon, Arizona, and Iowa. One thing supporting the rankings for these two states with the small tallies is that their placement did not vary much when compared to the 84 day period that lead up to it. Another state with a small data set was New Mexico, which perhaps was under valued by me during the process of screening reports. Idaho may have been a bit undervalued as well. Both of these two states are featured more prominently in the map I created for the peak weekend of June 22-24 (see 2nd concentration map below).

Other state rankings that I don't feel exceptionally confident about are those that have a report count that varies greatly between the two sources. As an Example, Washington state often has many more reports given by NUFORC (which happens to be its home state) than given by MUFON. Similarly, the state of Texas would often have many more reports coming from MUFON (which until recently was its home state) than NUFORC had for the same period. Coincidentally, both of these two states have a nearly identical population density (and both are close to the US state average). Population density is an important consideration in my ranking of the states and its related display of sighting concentration by state as shown in the maps that utilized the rating values given in the spreadsheets shown below.
.")

.")
.")
 by day of the week from 6/3-6/30/12 (MUFON data only).")
.")
The following is a breakdown of MUFON report data in 16 day increments by distance of UFO from the observer. At least 10% of the original reports were rejected by myself before tabulating the results. It would appear that there is a significantly larger proportion of IFOs in the first category of 501 feet to 1 mile distance, since the results are pretty consistent until the last 16 day period. The reason for the spike in that span of time is partly due to it including the 4th of July when there could be many reports due to Chinese lanterns (more than 1/3rd of the reports were for that date and 12 more occurred on 6/23, the busiest day in June). If one looks at only the close encounters (UFOs within 500 feet of the observer) it would seem that sightings peaked during the last 48 days out of the 64 days reviewed here.
Date...................501' to 1 mile.......101'-500'.......21'-100'.......0-20'
5/3-5/18....................50......................15..................3................4..
5/19-6/3....................51......................27.................13...............7..
6/4-6/19....................52......................28.................11...............3..
6/20-7/5....................90......................32..................5................2..