UFO Weather Report for July-August 2013
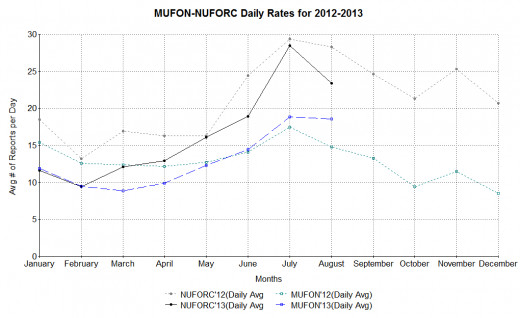
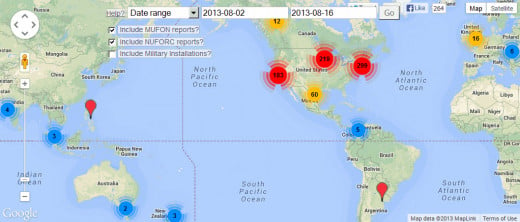
Thanks to the seasonal increase in UFO sightings reports in the United States on July 4th, the monthly tally for July came out ahead of the August one (as is usual). Looking at things a bit more closely, as the increase each 4th of July is mostly due to their being more witnesses than it has to do with an actual increase in true anomalous activity, a more significant increase can be seen for an extended number of days in August. If we look at activity for 28 days from July 5th through August 1st and compare it to the next 28 days from August 2nd through August 29th, we find that there were a total of 1060 reports in the first case and 1118 reports for the later (combining reports from MUFON and NUFORC). August was particularly strong for sightings from the 1st through the 17th, and especially for the middle days of the 5th through the 12th, with Close Encounter reports peaking on the 5th and 6th, all other U.S. reports peaking on the 7th, and with foreign reports peaking on the 8th.
That brings up another factor that is worth a look. As a general rule (based on my findings), if a given day or group of days has more foreign reports than usual, more weight can be given to a simultaneous (or nearly so) increase in reports within the United States. In other words there should be a higher percentage of true UFOs on a particularly active date in the U. S. when it is accompanied by a strong showing outside of its borders on the same or nearby date. This was not the case on July 4th, and it usually isn't the case then; thus my conclusion that it is not a true flap since, as was found by Rupelt at Blue Book after the 1952 wave, as a true wave or flap unfolds, so too does an increase in the percentage of true UFOs with a decrease in IFOs. If we look at the period from July 3rd through July 7th, 2013, we find that while there were an average of 111 sighting reports per day, only 3.25% were foreign. If we look at the peak in August from the 7th through the 12th, we find that of the 343 reports, averaging 57 per day, 15.74% were foreign. If we were to do a detailed study of all the reports during each of these two groups of dates, it is my strong belief that the quality of reports would be significantly greater, containing a much higher percentage of “Unknowns”, in the August group than in the July group.
A more interesting group of dates in July are those of the 10th through the 13th when there was an average of 38 reports per day (instead of the more usual 28 per day); but more importantly there was a percentage of 14.1% for the foreign reports. The two biggest dates for foreign reports in these two months for sightings were on July 12th and August 8th (with 15 reports each). These dates are separated by 27 days, with one of my UFO day cycles fitting evenly into that period 4 times. If that is when this cycle actually peaks then my calculations have been off by 2.5 days. I was predicting an increase in sightings when all four of my UFO day cycles would peak together, estimated to have been on July 7th and 8th, 2013 (it looks like it is time to go back to the drawing board).
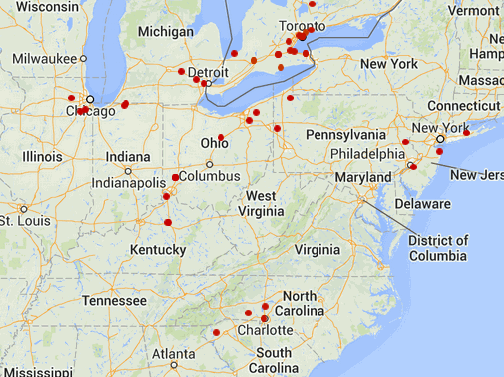
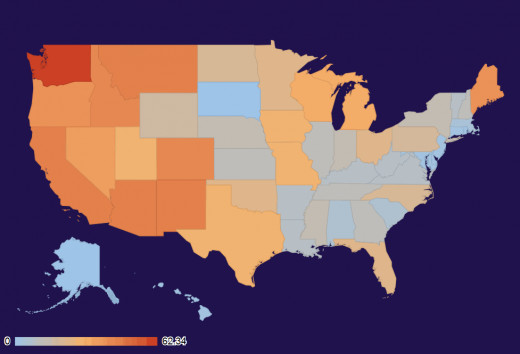
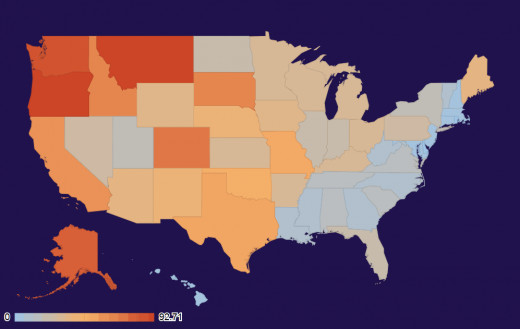
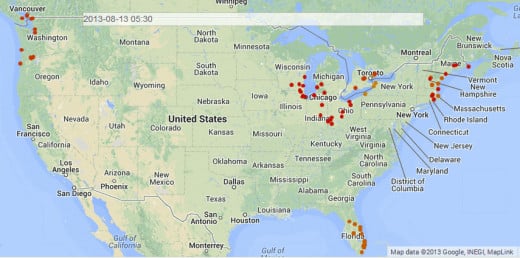
Looking at hotspot activity during the periods just mentioned, July 10th through the 13th showed strong report numbers from the Ontario, Canada area, but also in the nearby northeastern section of the U.S. There was also a strong showing for Montana but they were not considered to be hotspots since they were not linked enough in proximity of time and space (but Montana stands out strongly on the July state intensity map thanks to reports from these dates). From August 6th through the 13th, the Toronto, Canada area had less activity but sightings increased in the nearby northeastern U.S. There was also noteworthy activity in Florida and the Pacific northwest at that time.
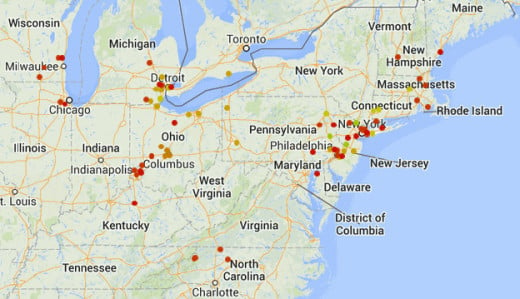
From the 18th through the 28th of August the reports contained only 7.4% foreign reports, so things appear to be cooling down for the moment, but this time of the year things can blow cold and then, after a few weeks, the heat is turned back up before cooling down again for months. Although UFO reports have cooled down during this more recent period than a week or two before, it is still notably higher or 39 reports per day rather than the more usual 28 (based on yearly averages for the periods of 2002 through 2011 for NUFORC and 2007 through 2010 for MUFON). And there is still hotspot activity in the northeastern portion of the U.S. (the more intense red dots in the close up image shown indicates newer dates). During the last few days of August 2013, there was increased hotspot activity in the Los Angeles area also. No hotspot activity has been shown for the first few days of September 2013, but without the NUFORC data to work with (their last post date was August 30th), that is not too unusual.
© 2013 Joseph Ritrovato

