ArtsAutosBooksBusinessEducationEntertainmentFamilyFashionFoodGamesGenderHealthHolidaysHomeHubPagesPersonal FinancePetsPoliticsReligionSportsTechnologyTravel

UFO Weather Report for May 2013

Updated on June 26, 2013
retrojoe profile image

MUFON UFO Journal author (March 1995, June 1996). Self published on UFO Window website from 1997 to 2002. Hubpages articles began late 2011.

UFO Intensity Map for the US states based on MUFON & NUFORC raw report data.


Typically, May is not a big month for UFOs. The same can usually be said for the first half of each year, but in 2012 it was different. All the months then had sightings significantly higher than for the corresponding months in all of the years for the prior decade. Sightings continued to increase in frequency until January 20th of 2013. After that, the UFO reports slowed down noticeably, but May in 2013 seems to show that the UFO numbers are back on track to becoming equal to last year's levels by as early as June. In the graph below one can clearly see that the gap between last year's sightings numbers and this year's is narrowing considerably. If the current trend continues, the UFO report numbers for the coming summer months could well surpass the tallies for the same period last year.


June 2013 average daily value is a projection based on MUFON data through June 22.  Values for MUFON uses data just for USA and NUFORC uses data for both USA and foreign reports.
June 2013 average daily value is a projection based on MUFON data through June 22. Values for MUFON uses data just for USA and NUFORC uses data for both USA and foreign reports.


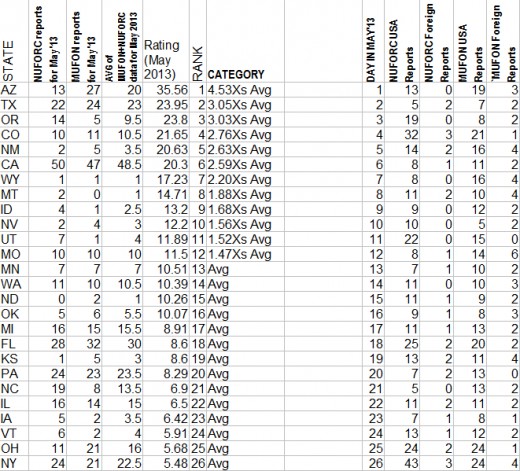
In other words, what we may have been experiencing over the last few months is a calm before a possible UFO storm or wave of activity. If such is to be the case, where might the center of the storm be? As would be usual, such a wave would take place in the western states. Oregon and Arizona have been in the forefront lately, but Oregon dropped out of the picture during a recent flap around Memorial Day while Arizona remained with a consistently high.frequency of sightings numbers (as reflected in the graphic map below). Also, there was a big flap near Phoenix, Arizona just before the UFO slow down in late January occurred across the United States.


UFO Intensity Map of US states for May 24-27, 2013 (resulting from MUFON & NUFORC raw sightings report data and factoring population density).


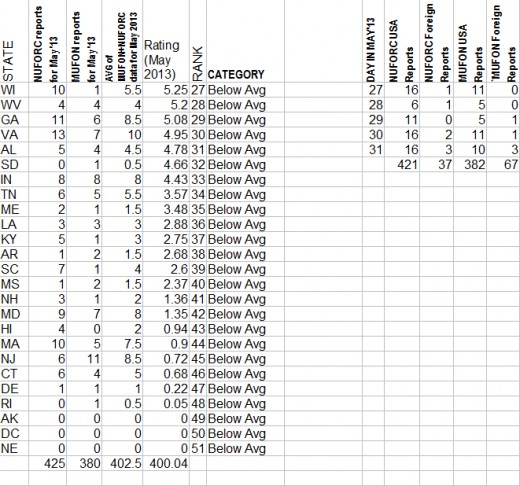
In the map above it would appear that Wyoming and Montana show a higher concentration of sightings than in Arizona and New Mexico. Technically this is true but the results are not as reliable as for Arizona. The reason for this is that between MUFON and NUFORC's data, there was just one UFO report for each of the two northern states and 9 and 2 for Arizona and New Mexico respectively. The reason that those two northern states show a greater intensity with fewer reports is due to them having a much smaller population density than the two southern states. With Wyoming and Montana, if their reports were to be discredited, they would go from the top of the list down to the bottom. If Arizona lost one report for the same reason it would only make a slight dent in its ranking.


Combined MUFON & NUFORC sightings report data broken down by days of the week for the first four weeks of May 2013 (bars) plus the combined day of the week totals of MUFON & NUFORC foreign reports for the first 28 days of May 2013 (line).


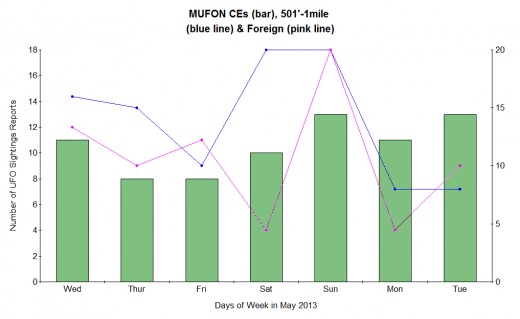
Now that I have pointed you in the direction of Arizona for the most likely “where” to be to witness a UFO, what day of the week might be best? Above is a graph showing how each day of the week fared during the first four weeks of May 2013. Saturday is typically a leader because more people are out and about to potentially witness a sighting. In other words, the numbers on that day are high usually not because there were more UFOs to see, but more people to see them and thus more reports filed. Sunday doesn't have that aspect going for it as much usually, but Sunday May 26th was different. That was the evening before Memorial Day so like other three day weekends, Sunday becomes like a second Saturday night in a row. That would seem to explain why that Sunday was the highest yielding day for sightings during May 2013. However, if we look at the foreign reports, where Memorial Day isn't a factor, Sunday was the highest weekday for reports during that month.

So it would seem that something was going on on that day of the week (especially demonstrated in the NUFORC data (that day had more than three times the daily average for the month). I have already predicted that my three UFO day cycles along with a newly discovered one of 26 days in length would peak together (as they last did in March 1974) on July 7-8 of 2013. The most prominent of these day cycles, if I were to pick just one, is of 7.1436 days in length (although the 6.76 day cycle may be just as prominent). That cycle was also peaking on May 26, 2013 (along with a cycle of 7.00755 days in length that peaked on or just after that day).


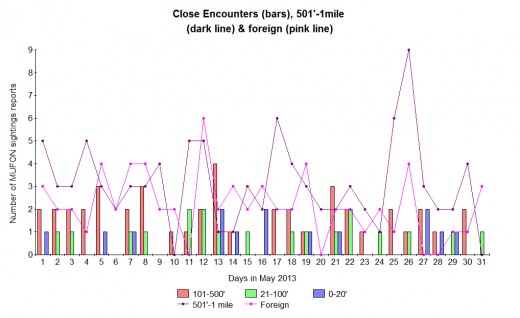
In the graphic chart above we see results of the MUFON report data only. The bars represent close encounters (UFOs in the US that are 500 feet or less from the witness) by the day of the month in May 2013 and the lines represent US reports where UFOs were within 501 feet to 1 mile of the witness and foreign reports. The US reports of UFOs within 501 feet to 1 mile from the witnesses regularly have strong showings on Saturday nights (along with Sundays on 5/12 & 5/26) while the foreign reports show very consistent high levels on Sundays. That is shown a bit more clearly in the graphic below which combines the CE reports into single bar totals.

My next UFO weather report (for June) should likely be coming out in 2 parts. The first one will be issued post haste to give a last minute heads up on the most likely location for a flap to occur on July 7-8 (and also probably including the day before). A more thorough report will follow the predicted flap at some point.


Copyright © 2013 Joseph W. Ritrovato


working

This website uses cookies

As a user in the EEA, your approval is needed on a few things. To provide a better website experience, hubpages.com uses cookies (and other similar technologies) and may collect, process, and share personal data. Please choose which areas of our service you consent to our doing so.

For more information on managing or withdrawing consents and how we handle data, visit our Privacy Policy at: https://corp.maven.io/privacy-policy

Show Details
Necessary
HubPages Device IDThis is used to identify particular browsers or devices when the access the service, and is used for security reasons.
LoginThis is necessary to sign in to the HubPages Service.
Google RecaptchaThis is used to prevent bots and spam. (Privacy Policy)
AkismetThis is used to detect comment spam. (Privacy Policy)
HubPages Google AnalyticsThis is used to provide data on traffic to our website, all personally identifyable data is anonymized. (Privacy Policy)
HubPages Traffic PixelThis is used to collect data on traffic to articles and other pages on our site. Unless you are signed in to a HubPages account, all personally identifiable information is anonymized.
Amazon Web ServicesThis is a cloud services platform that we used to host our service. (Privacy Policy)
CloudflareThis is a cloud CDN service that we use to efficiently deliver files required for our service to operate such as javascript, cascading style sheets, images, and videos. (Privacy Policy)
Google Hosted LibrariesJavascript software libraries such as jQuery are loaded at endpoints on the googleapis.com or gstatic.com domains, for performance and efficiency reasons. (Privacy Policy)
Features
Google Custom SearchThis is feature allows you to search the site. (Privacy Policy)
Google MapsSome articles have Google Maps embedded in them. (Privacy Policy)
Google ChartsThis is used to display charts and graphs on articles and the author center. (Privacy Policy)
Google AdSense Host APIThis service allows you to sign up for or associate a Google AdSense account with HubPages, so that you can earn money from ads on your articles. No data is shared unless you engage with this feature. (Privacy Policy)
Google YouTubeSome articles have YouTube videos embedded in them. (Privacy Policy)
VimeoSome articles have Vimeo videos embedded in them. (Privacy Policy)
PaypalThis is used for a registered author who enrolls in the HubPages Earnings program and requests to be paid via PayPal. No data is shared with Paypal unless you engage with this feature. (Privacy Policy)
Facebook LoginYou can use this to streamline signing up for, or signing in to your Hubpages account. No data is shared with Facebook unless you engage with this feature. (Privacy Policy)
MavenThis supports the Maven widget and search functionality. (Privacy Policy)
Marketing
Google AdSenseThis is an ad network. (Privacy Policy)
Google DoubleClickGoogle provides ad serving technology and runs an ad network. (Privacy Policy)
Index ExchangeThis is an ad network. (Privacy Policy)
SovrnThis is an ad network. (Privacy Policy)
Facebook AdsThis is an ad network. (Privacy Policy)
Amazon Unified Ad MarketplaceThis is an ad network. (Privacy Policy)
AppNexusThis is an ad network. (Privacy Policy)
OpenxThis is an ad network. (Privacy Policy)
Rubicon ProjectThis is an ad network. (Privacy Policy)
TripleLiftThis is an ad network. (Privacy Policy)
Say MediaWe partner with Say Media to deliver ad campaigns on our sites. (Privacy Policy)
Remarketing PixelsWe may use remarketing pixels from advertising networks such as Google AdWords, Bing Ads, and Facebook in order to advertise the HubPages Service to people that have visited our sites.
Conversion Tracking PixelsWe may use conversion tracking pixels from advertising networks such as Google AdWords, Bing Ads, and Facebook in order to identify when an advertisement has successfully resulted in the desired action, such as signing up for the HubPages Service or publishing an article on the HubPages Service.
Statistics
Author Google AnalyticsThis is used to provide traffic data and reports to the authors of articles on the HubPages Service. (Privacy Policy)
ComscoreComScore is a media measurement and analytics company providing marketing data and analytics to enterprises, media and advertising agencies, and publishers. Non-consent will result in ComScore only processing obfuscated personal data. (Privacy Policy)
Amazon Tracking PixelSome articles display amazon products as part of the Amazon Affiliate program, this pixel provides traffic statistics for those products (Privacy Policy)
ClickscoThis is a data management platform studying reader behavior (Privacy Policy)