Where to Really Go to See UFOs


Two Better Ways to View the UFO Numbers for US States
Each month on the first of the month, MUFON comes out with their "National UFO Alert" rating system; a statistical view of how intense UFO activity is in general in the U.S. and also how the top states rate that get at least ten sightings each per state during the previous month. Unfortunately, they do not take into account population and geographical area of each state in their analysis, so the results are flawed. In other words, based on their ranking, only three or four (depending on the alternate formula used) out of their top ten ought to be in such a list. Their latest rankings put California in first place, but if you use a formula that looks at sightings per 100,000 population in each state, California becomes just average. Texas is in third place but when using the same alternate gauge, it comes in last place. Since they only list states that had at least ten sightings, they remove states that deserve to be on the top of the list since they have such a small population. For instance Montana, and Alaska are at the top of both of my lists using two different methods, but are not even included on theirs.
My interest in ranking states based on UFO sightings began with my first article for MUFON in their March 1995 issue. In that piece I was predicting a flap of activity at the time and tried to come up with good locations to try to hunt for UFOs. The only problem was that back in 1995 I was limited to just the literature that gave sightings from many years before. The data wasn't fresh. By the time I produced my first internet article (two MUFON articles and around 18 months later) I was using Larry Hatch's *U* UFO database and gathering recent sightings off the net for him and myself. Using his software I produced a list shown below that gave values and rankings for each state in the U.S. for several periods of time in the history of UFOs.
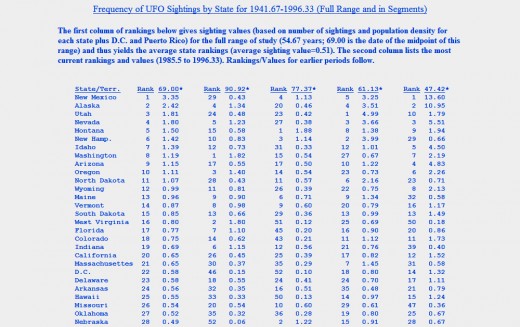
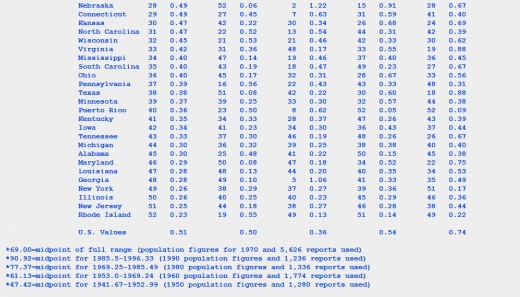
As you can see from the figures, the early years (given on the right; the averages are given on the left) were the most significant. However, even now certain states stand out (many of the same that were outstanding then such as Montana, Utah, and Washington). For those who may be interested, here is the formula I used to produce this information:
(Sightings per area / area in sq. miles) X 100,000..................... 10 Yrs.
-------------------------------------------------------------------......X.... -------------------
......Population per area / area in sq. miles............................. Period in Yrs.
(Description: *Value=Sightings per person per sq. mile X 100,000 and adjusted for a 10 year constant period)
I am now a bit embarrassed about this, but the above formula, although it comes up with some valid results, causes the area in square miles to cancel out as a factor and thus it is simply yielding the number of sightings per 100,000 population. A more simple formula that arrives at the same answer is as follows:
100,000
--------------------- X # of Sightings in State = # of Sightings per 100,000 population
Population in State
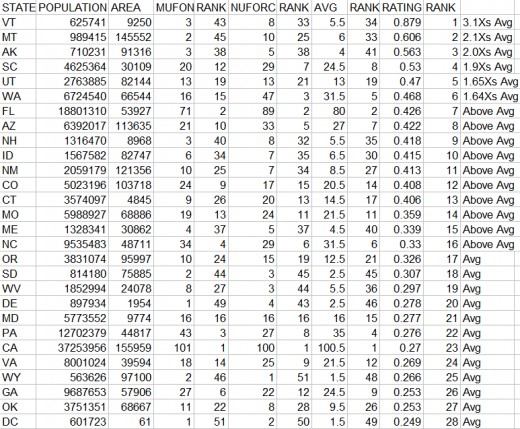
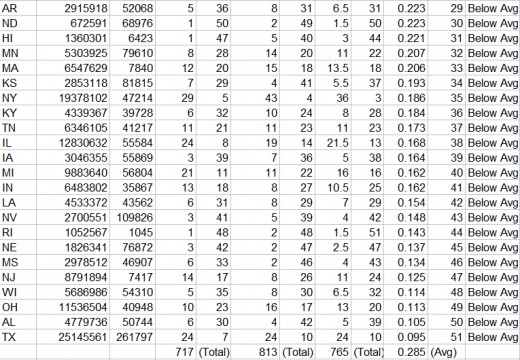
I now turn your attention to the values and rankings attained after collecting 51 days of data beginning with December 1st of 2011. I have resurrected the formula I devised then (without the multiplier for a 10 year constant period) to come up with rankings of the states based on that 51 day period, ending on January 20, 2012. The most important information is to the right of the spreadsheet shown below. There you will find the values derived from the following state information: Population figures from 2010 and the average sighting values for each state from MUFON and NUFORC (land area doesn't get factored in until later in this hub). What this list says, contrary to the MUFON list, is that one should be spending time looking mostly at states that have a higher ratio of people to each sighting. This would tend to favor the less dense, more sparsely populated states and some of the smaller states. For example, Vermont and New Hampshire are states with small populations. As a result, their average of 5.5 sightings carry more weight than the average of 24 sightings in Texas that has anywhere from 19 to 40 times the population of either one of those two states. There are exceptions to this rule however. South Carolina, Washington, Florida, and Arizona; even Colorado, Missouri and North Carolina, are states with large populations that are in the above average category (with five out of those seven in the top ten based on just the average number of sightings alone). But one should not overlook the three states mentioned earlier (Vermont, Montana, and Alaska) at the top of the list, or other states with a similar profile such as Utah, New Hampshire, Idaho, New Mexico, Connecticut, and Maine. Of those nine states, only Utah and Connecticut were on MUFON's top 21 states to watch based on the number of UFO sightings in the prior month.
As I mentioned earlier, California and Texas shouldn't even be in their top 21 list (when considering population and not area). The same could be said for Pennsylvania, Illinois, Georgia, New York, Virginia, Ohio, New Jersey, and Tennessee. On the other hand, my list isn't perfect because it uses raw, mostly unfiltered data from the two primary sources of UFO sightings data. It contains hoaxes and duplicates. Yet, by averaging the two sources and looking at a time when UFO sightings were on the rise (since there is usually a higher percentage of true UFOs during such times), I think that the positives cancel out most of the negative aspects of my tally. Since there could be more reliable results from using a longer period than 51 days worth of sightings numbers, I next will be expanding the rankings to include sightings ranks based on a yearly average from a four year period of 2008-2011. I will next be factoring in geographic area as well (but also still using just the raw NUFORC sighting data; I will most likely filter the data better when utilizing these methods in related future hub articles).
Assessing the data using a new/improved formula
Now for another look at the data. This time we will use a new formula that modifies the number of sightings per state so that it yields what the numbers would be if all the states had a population density of 100 people per square mile (about the same as in Washington state). To do so the following formula is used:
100
------------------------------------------------------ X Sightings per Year
State Population ÷ Area in Square Miles
In the spreadsheet below, we will be concentrating on columns J through N. Sorted in order by rank, column J has the most recent rating values or for the 51 days from December 1, 2011 through January 20, 2012. The formula above was used to get these figures but the final result was multiplied by 7.161764706, or the number of times 51 days goes into 365.25 days. This of course was to yield a result that can be defined as the number of expected yearly UFO sightings in a given state if the population density was 100 people per square mile. This was done also to be able to compare the results in this column with what was arrived at in column M. In that column are the results of using this same formula but plugging in the average number of sightings per year for the period of years from 2008-2011 (based on NUFORC raw reporting figures).
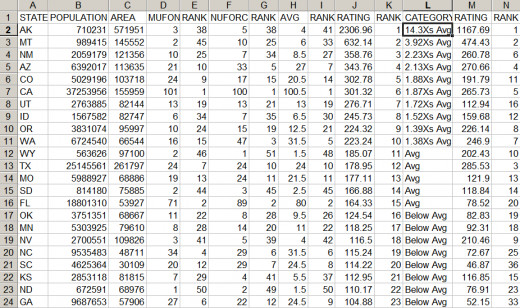
Since column J is based on an average between the MUFON and NUFORC data which in general results in figures that were 5.9% less than if the NUFORC data was used alone, and the total of the values in column J are 1.35Xs greater than the total of the values in column M, it would seem that the recent 51 day period being studied presents a higher concentration than the yearly average for the past four years. Also, considering that December and January are usually below average months, the timing seasonally makes the increase even more significant.
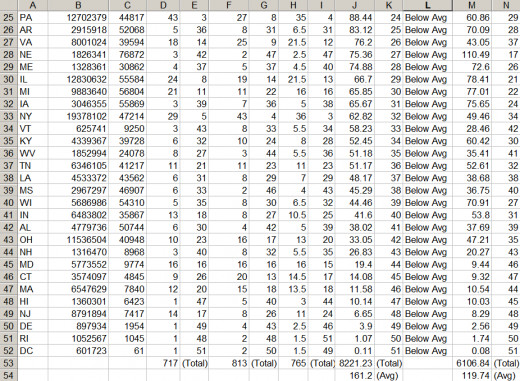
There are some notable differences between this spreadsheet based on this last formula when compared to the previous one that utilized the older and more simple formula. California is now ranked above average instead of just average and Texas is now average instead of last on the list. Montana and Alaska are still high on the list, but Vermont and South Carolina are no longer contenders. New Hampshire and Connecticut move far down the list from above average to below average. Oregon moves up from 17th to 9th place and Washington drops from 6th to 10th. Florida falls from 7th to 15th place, Colorado moves up from 12th to 5th place, and New Mexico from 11th to 3rd place. There is also a more pronounced rating effect for the top ten placers in the new list with an average of 3.234 above the average for all of the states, compared to an average of 1.829 on the old list. There are fewer states that are average and above (15) than before (28). Also, if one compares the top eight states for the 51 day period (column J) to the ratings based on the yearly average for the 2008-2011 period (column M), one sees a very significant rise in the numbers. It would seem that we had a flap or mini-wave in activity for at least a few of those states (especially Utah, Alaska, Colorado, and Idaho). And that may not be over; it remains to be seen what will happen in the coming months. In general, in my opinion, it would seem that this new formula does a much better job of determining the best states to observe UFOs in.
I'll leave you with a link to another list of UFO hotspots by Dr. Donald Johnson who utilized the UFOCAT database to come up with his figures (also using a formula like my first one). Although his listing is older, one advantage is that he gives the sighting hotspots narrowed down to individual counties rather than states:
http://www.cufon.org/cufon/300topufo.htm
© 2012 Joseph Ritrovato