- HubPages»
- Sports and Recreation»
- Team Sports»
- American Football»
- NFL Football
AFL/NFL 3,000 Yard Passers State by State Rank: Installment 2
Installment 2 of our database gives in-depth statistical data for states 6-10 in our per capita ranking system.
For those of you interested in an overview of the rankings, a table can be found by clicking the installment 1 link in the text box to your right. In addition, links to all installments for the 3,000 yard passer database can be found in the text box to your right.
For those of you that are interested in other state football production databases presented by Larry Rankin, links can be found by clicking the Larry Rankin profile in the upper right-hand corner or via links at the end of this page.
References
In compiling this data the author used NFL.com, Profootballreference.com, and Wikipedia for research.
If you encounter any information you believe to be flawed, the author would appreciate your feedback.

6. Kansas
Per Capita Score: 449
3,000 Yard Passing Performances: 13
Kansas hasn’t produced any great quarterbacks, but they’ve produced a few good ones. This compounded with the fact they are sparsely populated leads them to be placed 6th on our per capita ranking.
The best to come out of Kansas is by far Jim Everett, who is probably most well recognized for his altercation with sports shock-jock Jim Rome, who insisted on calling Jim Everett by the name Cris Everett, the name of a famous professional women’s tennis player.
This isn’t fair for two reasons: Rome was the one being the biggest jerk, yet Everett caught the most fallout over the incident, and by focusing on this little blip in history, we lose track of the fact that Everett had a very good career.
Dubious Distinction: John Hadl’s 47.3% completion percentage in 1968 is the lowest of any QB to finish a season with 3,000 or more yards passing.
Kansas 3,000 Yard Passing Performances
Year/Team
| Name
| Yds
| Cmp
| Att
| Cmp%
| TD
| Int
| Rtng
|
|---|---|---|---|---|---|---|---|---|
1983 GB Pack
| Lynn Dickey
| 4,458
| 289
| 484
| 59.7
| 32
| 29
| 87.3
|
1989 LA Ram
| Jim Everett
| 4,310
| 304
| 518
| 58.7
| 29
| 17
| 90.6
|
1990 LA Ram
| Jim Everett
| 3,989
| 307
| 554
| 55.4
| 23
| 17
| 79.3
|
1995 NO Saints
| Jim Everett
| 3,970
| 345
| 567
| 60.8
| 26
| 14
| 87.0
|
1988 LA Ram
| Jim Everett
| 3,964
| 308
| 517
| 59.6
| 31
| 18
| 89.2
|
1994 NO Saints
| Jim Everett
| 3,855
| 346
| 540
| 64.1
| 22
| 18
| 84.9
|
1980 GB Pack
| Lynn Dickey
| 3,529
| 278
| 478
| 58.2
| 15
| 25
| 70.0
|
1968 SD Chrg
| John Hadl
| 3,473
| 208
| 440
| 47.3
| 27
| 32
| 64.5
|
1991 LA Ram
| Jim Everett
| 3,438
| 277
| 490
| 56.5
| 11
| 20
| 68.9
|
1967 SD Chrg
| John Hadl
| 3,365
| 217
| 427
| 50.8
| 24
| 22
| 74.5
|
1992 LA Rams
| Jim Everett
| 3,323
| 281
| 475
| 59.2
| 22
| 18
| 80.2
|
1984 GB Pack
| Lynn Dickey
| 3,195
| 237
| 401
| 59.1
| 25
| 19
| 85.6
|
1971 SD Chrg
| John Hadl
| 3,075
| 233
| 431
| 54.1
| 21
| 25
| 68.9
|
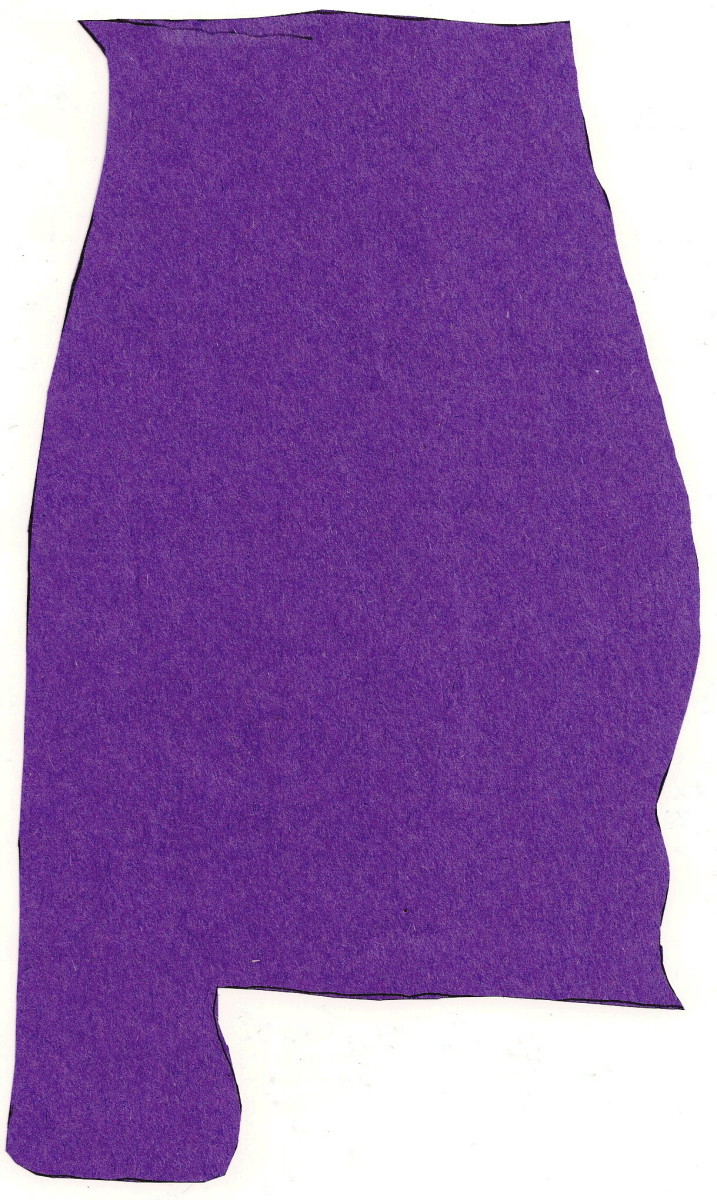
7. Alabama
Per Capita Score: 290
3,000 Yard Passing Performances: 14
Philip Rivers has had a wonderful career so far, and if he can manage to win a Super Bowl at some point, may find himself in the Hall of Fame someday.
Ken Stabler finished his career at an impressive 96-49-1, has a Super Bowl ring, and has been up for Hall of Fame selection 3 times, but has yet to get over the hump.
Alabama 3,000 Yard Passing Performances
Year/Team
| Name
| Yds
| Cmp
| Att
| Cmp%
| TD
| Int
| Rtng
|
|---|---|---|---|---|---|---|---|---|
2010 SD Chrg
| Philip Rivers
| 4,710
| 357
| 541
| 66.0
| 30
| 13
| 101.8
|
2011 SD Chrg
| Philip Rivers
| 4,624
| 366
| 582
| 62.9
| 27
| 20
| 88.7
|
2013 SD Chrg
| Philip Rivers
| 4,478
| 378
| 544
| 69.5
| 32
| 11
| 105.5
|
2009 SD Chgr
| Philip Rivers
| 4,254
| 317
| 486
| 65.2
| 28
| 9
| 104.4
|
2008 SD Chrg
| Philip Rivers
| 4,009
| 312
| 478
| 65.3
| 34
| 11
| 105.5
|
1979 Oak Rai
| Ken Stabler
| 3,615
| 304
| 498
| 61.0
| 26
| 22
| 82.2
|
2012 SD Chrg
| Philip Rivers
| 3,606
| 338
| 527
| 64.1
| 26
| 15
| 88.6
|
1983 NY Jets
| Richard Todd
| 3,478
| 308
| 518
| 59.5
| 18
| 26
| 70.3
|
2006 SD Chrg
| Philip Rivers
| 3,388
| 284
| 460
| 61.7
| 22
| 9
| 92.0
|
1980 NY Jets
| Richard Todd
| 3,329
| 264
| 479
| 55.1
| 17
| 30
| 62.7
|
1981 NY Jets
| Richard Todd
| 3,231
| 279
| 497
| 56.1
| 25
| 13
| 81.8
|
1980 Hou Oil
| Ken Stabler
| 3,202
| 293
| 457
| 64.1
| 13
| 28
| 68.7
|
2007 SD Chrg
| Philip Rivers
| 3,152
| 277
| 460
| 60.2
| 21
| 15
| 82.4
|
2011 Sea Shwk
| Tarvaris Jackson
| 3,091
| 271
| 450
| 60.2
| 14
| 13
| 79.2
|

8. Utah
Per Capita Score: 276
3,000 Yard Passing Performances: 8
Steve Young had a Hall of Fame career. Though he has two Super Bowl rings, in his first appearance he was backup to Joe Montana and saw little play time.
In his second Super Bowl appearance, he was the starter and won MVP.
Early in his career Young was best known for his elusiveness as a runner. For years he was a backup to Joe Montana, but when he got his chance, he shined brightly.
Statistically the most amazing aspect of Young’s career was his passer rating. Not only did he have a QB rating of over a 100 at a time in history when only a handful of players had managed to do so, he finished a staggering 7 seasons with a 100 plus rating.
Utah 3,000 Yard Passing Performances
Year/Team
| Name
| Yds
| Cmp
| Att
| Cmp%
| TD
| Int
| Rtng
|
|---|---|---|---|---|---|---|---|---|
1995 Det Lions
| Scott Mitchell
| 4,338
| 346
| 583
| 59.3
| 32
| 12
| 92.3
|
1998 SF 49ers
| Steve Young
| 4,170
| 322
| 517
| 62.3
| 36
| 12
| 101.1
|
1993 SF 49ers
| Steve Young
| 4,023
| 314
| 462
| 68.0
| 29
| 16
| 101.5
|
1994 SF 49ers
| Steve Young
| 3,969
| 324
| 461
| 70.3
| 35
| 10
| 112.8
|
1997 Det Lions
| Scott Mitchell
| 3,484
| 293
| 509
| 57.6
| 19
| 14
| 79.6
|
1992 SF 49ers
| Steve Young
| 3,465
| 268
| 402
| 66.7
| 25
| 7
| 107.0
|
1995 SF 49ers
| Steve Young
| 3,200
| 299
| 447
| 66.9
| 20
| 11
| 92.3
|
1997 SF 49ers
| Steve Young
| 3,029
| 241
| 356
| 67.7
| 19
| 6
| 104.7
|
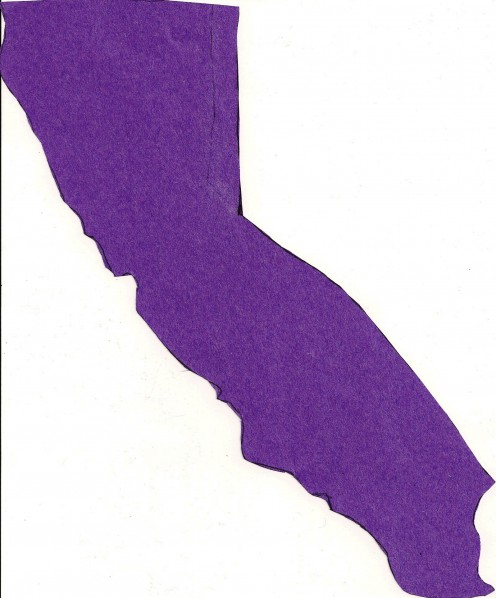
9. California
Per Capita Score: 258
3,000 Yard Passing Performances: 99
By leaps and bounds California leads the way in number of 3,000 yard passers. There are so many notable players on this list, one could not hope to summarize all their accomplishments.
Regardless, here is a quick rundown: Multiple Super Bowl winner Tom Brady, revolutionary QB and Hall of Famer Dan Fouts, statistical dynamo Tony Romo, the never ending career that spanned two leagues and ended with a Hall of Fame induction for Warren Moon, the supreme efficiency of Aaron Rodgers, the limitless talent of Randall Cunningham, the indelible spirit of Jeff Garcia, and the unwavering stability of Hall of Famer Troy Aikman are just a few of the amazing characteristics that can be found in California born quarterbacks.
Obscure Stats: Aaron Rodgers QB rating of 122.5 in 2011 is the highest in NFL history for a Quarterback finishing a season with over 3,000 yards passing.
Obscure Stats: Tom Brady’s 4 interceptions in 2010 and Steve DeBerg’s 4 interceptions in 1990 are the fewest interceptions thrown in a season for a QB finishing with over 3,000 yards.
Obscure Stats: Jack Kemp’s 3,018 passing yards in 1960, along with two other QBs who accomplished the feat that same year, marks the first year a quarterback surpassed 3,000 yards.
California 3,000 Yard Passing Performances
Year/Team
| Name
| Yds
| Cmp
| Att
| Cmp%
| TD
| Int
| Rtng
|
|---|---|---|---|---|---|---|---|---|
2011 NE Pats
| Tom Brady
| 5,235
| 401
| 611
| 65.6
| 39
| 12
| 105.6
|
2012 Dal Cwby
| Tony Romo
| 4,903
| 425
| 648
| 65.6
| 28
| 19
| 90.5
|
2012 NE Pats
| Tom Brady
| 4,827
| 401
| 637
| 63.0
| 34
| 8
| 98.7
|
2007 NE Pats
| Tom Brady
| 4,806
| 398
| 578
| 68.9
| 50
| 8
| 117.2
|
1981 SD Chrg
| Dan Fouts
| 4,802
| 360
| 609
| 59.1
| 33
| 17
| 90.6
|
1980 SD Chrg
| Dan Fouts
| 4,715
| 348
| 589
| 59.1
| 30
| 24
| 84.7
|
1991 Hou Oil
| Warren Moon
| 4,690
| 404
| 655
| 61.7
| 23
| 21
| 81.7
|
1990 Hou Oil
| Warren Moon
| 4,689
| 362
| 584
| 62.0
| 33
| 13
| 96.8
|
2011 GB Pack
| Aaron Rodgers
| 4,643
| 343
| 502
| 68.3
| 45
| 6
| 122.5
|
2009 Dal Cwby
| Tony Romo
| 4,483
| 347
| 550
| 63.1
| 26
| 9
| 97.6
|
1999 Car Pan
| Steve Beuerlein
| 4,436
| 343
| 571
| 60.1
| 36
| 15
| 94.6
|
2009 GB Pack
| Aaron Rodgers
| 4,434
| 350
| 541
| 64.7
| 30
| 7
| 103.2
|
2009 NE Pats
| Tom Brady
| 4,398
| 371
| 565
| 65.7
| 28
| 13
| 96.2
|
1996 Jax Jag
| Mark Brunell
| 4,367
| 353
| 557
| 63.4
| 19
| 20
| 84.0
|
1983 KC Chief
| Bill Kenney
| 4,348
| 346
| 603
| 57.4
| 24
| 18
| 80.8
|
2013 NE Pats
| Tom Brady
| 4,343
| 380
| 628
| 60.5
| 25
| 11
| 87.3
|
2012 GB Pack
| Aaron Rodgers
| 4,295
| 371
| 552
| 67.2
| 39
| 8
| 108.0
|
2000 SF 49ers
| Jeff Garcia
| 4,278
| 355
| 561
| 63.3
| 31
| 10
| 97.6
|
2013 Ari Cards
| Carson Palmer
| 4,274
| 362
| 572
| 63.3
| 24
| 22
| 83.9
|
1994 Min Vik
| Warren Moon
| 4,264
| 371
| 601
| 61.7
| 18
| 19
| 79.9
|
1995 Min Vik
| Warren Moon
| 4,228
| 377
| 606
| 62.2
| 33
| 14
| 91.5
|
2007 Dal Cwby
| Tony Romo
| 4,211
| 335
| 520
| 64.4
| 36
| 19
| 97.4
|
2011 Dal Cwby
| Tony Romo
| 4,184
| 346
| 522
| 66.3
| 31
| 10
| 102.5
|
1980 Cle Brwn
| Brian Sipe
| 4,132
| 337
| 554
| 60.8
| 30
| 14
| 91.4
|
2007 Cin Beng
| Carson Palmer
| 4,131
| 373
| 575
| 64.9
| 26
| 20
| 86.7
|
2005 NE Pats
| Tom Brady
| 4,110
| 334
| 530
| 63.0
| 26
| 14
| 92.3
|
1979 SD Chrg
| Dan Fouts
| 4,082
| 332
| 530
| 62.6
| 24
| 24
| 82.6
|
2008 GB Pack
| Aaron Rodgers
| 4,038
| 341
| 536
| 63.6
| 28
| 13
| 93.8
|
2006 Cin Beng
| Carson Palmer
| 4,035
| 324
| 520
| 62.3
| 28
| 13
| 93.9
|
2012 Oak Rai
| Carson Palmer
| 4,018
| 345
| 565
| 61.1
| 22
| 14
| 85.3
|
2010 Cin Beng
| Carson Palmer
| 3,970
| 362
| 586
| 61.8
| 26
| 20
| 82.4
|
2010 GB Pack
| Aaron Rodgers
| 3,922
| 312
| 475
| 65.7
| 28
| 11
| 101.2
|
2010 NE Pats
| Tom Brady
| 3,900
| 324
| 492
| 65.9
| 36
| 4
| 111.0
|
1981 Cle Brwn
| Brian Sipe
| 3,876
| 313
| 567
| 55.2
| 17
| 25
| 68.2
|
1995 Chi Bears
| Erik Kramer
| 3,838
| 315
| 522
| 60.3
| 29
| 10
| 93.5
|
2005 Cin Beng
| Carson Palmer
| 3,836
| 345
| 509
| 67.8
| 32
| 12
| 101.1
|
2013 Dal Cwby
| Tony Romo
| 3,828
| 342
| 535
| 63.9
| 31
| 10
| 96.7
|
1988 Phi Eagles
| Randall Cunningham
| 3,808
| 301
| 560
| 53.8
| 24
| 16
| 77.6
|
1979 Cle Brwn
| Brian Sipe
| 3,793
| 286
| 535
| 53.5
| 28
| 26
| 73.4
|
2001 NY Gia
| Tom Brady
| 3,764
| 373
| 601
| 62.1
| 28
| 14
| 85.7
|
1984 SD Chrg
| Dan Fouts
| 3,740
| 317
| 507
| 62.5
| 19
| 17
| 83.4
|
2000 Car Pan
| Steve Beuerlein
| 3,730
| 324
| 533
| 60.8
| 19
| 18
| 79.7
|
1998 Min Vik
| Randall Cunningham
| 3,704
| 259
| 425
| 60.9
| 34
| 10
| 106.0
|
2008 NE Pats
| Matt Cassel
| 3,693
| 327
| 516
| 63.4
| 21
| 11
| 89.4
|
2004 NE Pats
| Tom Brady
| 3,692
| 288
| 474
| 60.8
| 28
| 14
| 92.6
|
1997 Sea Shwk
| Warren Moon
| 3,678
| 313
| 528
| 59.3
| 25
| 16
| 83.7
|
1979 Sea Shwk
| Jim Zorn
| 3,661
| 285
| 505
| 56.4
| 20
| 18
| 77.7
|
1979 SF 49ers
| Steve DeBerg
| 3,652
| 347
| 578
| 60.0
| 17
| 21
| 73.1
|
2000 Jax Jag
| Mark Brunell
| 3,640
| 311
| 512
| 60.7
| 20
| 14
| 84.0
|
1985 SD Chrg
| Dan Fouts
| 3,638
| 254
| 430
| 59.1
| 27
| 20
| 88.1
|
1989 Hou Oil
| Warren Moon
| 3,631
| 280
| 464
| 60.3
| 23
| 14
| 88.9
|
2003 NE Pats
| Tom Brady
| 3,620
| 317
| 527
| 60.2
| 23
| 12
| 85.9
|
1983 Cle Brwn
| Brian Sipe
| 3,566
| 291
| 496
| 58.7
| 26
| 23
| 79.1
|
1984 TB Bucs
| Steve DeBerg
| 3,554
| 308
| 509
| 60.5
| 19
| 18
| 79.3
|
2001 SF 49ers
| Jeff Garcia
| 3,538
| 316
| 504
| 62.7
| 32
| 12
| 94.8
|
2004 Hou Tex
| David Carr
| 3,531
| 285
| 466
| 61.2
| 16
| 14
| 83.5
|
2006 NE Pats
| Tom Brady
| 3,529
| 319
| 516
| 61.8
| 24
| 12
| 87.9
|
1986 Hou Oil
| Warren Moon
| 3,489
| 256
| 488
| 52.5
| 13
| 26
| 62.3
|
1993 Hou Oil
| Warren Moon
| 3,485
| 303
| 520
| 58.3
| 21
| 21
| 75.2
|
2011 NY Jets
| Mark Sanchez
| 3,474
| 308
| 503
| 56.7
| 26
| 18
| 78.2
|
1984 Cle Brwn
| Paul McDonald
| 3,472
| 271
| 493
| 55.0
| 14
| 23
| 67.3
|
1990 Phi Eagles
| Randall Cunningham
| 3,466
| 271
| 465
| 58.3
| 30
| 13
| 91.6
|
1989 Atl Fal
| Chris Miller
| 3,459
| 280
| 526
| 53.2
| 16
| 10
| 76.1
|
2008 Dal Cwby
| Tony Romo
| 3,448
| 276
| 450
| 61.3
| 26
| 14
| 91.4
|
1992 Dal Cwby
| Troy Aikman
| 3,445
| 302
| 473
| 63.8
| 23
| 14
| 89.5
|
1990 KC Chief
| Steve DeBerg
| 3,444
| 258
| 444
| 58.1
| 23
| 4
| 96.3
|
1989 Phi Eagles
| Randall Cunningham
| 3,400
| 290
| 532
| 54.5
| 21
| 15
| 75.5
|
1980 Sea Shwk
| Jim Zorn
| 3,346
| 276
| 488
| 56.6
| 17
| 20
| 72.3
|
2002 SF 49ers
| Jeff Garcia
| 3,344
| 328
| 528
| 62.1
| 21
| 10
| 85.6
|
1984 Hou Oil
| Warren Moon
| 3,338
| 259
| 450
| 57.6
| 12
| 14
| 76.9
|
1986 NE Pats
| Tony Eason
| 3,328
| 276
| 448
| 61.6
| 19
| 10
| 89.2
|
2001 Jax Jag
| Mark Brunell
| 3,309
| 289
| 473
| 61.1
| 19
| 13
| 84.1
|
1995 Dal Cwby
| Troy Aikman
| 3,304
| 280
| 432
| 64.8
| 16
| 7
| 93.6
|
1969 Oak Rai
| Daryle Lamonica
| 3,302
| 221
| 426
| 51.9
| 34
| 25
| 79.8
|
2010 NY Jets
| Mark Sanchez
| 3,291
| 278
| 507
| 54.8
| 17
| 13
| 75.3
|
1997 Dal Cwby
| Troy Aikman
| 3,283
| 292
| 518
| 56.4
| 19
| 12
| 78.0
|
1978 Sea Shwk
| Jim Zorn
| 3,283
| 248
| 443
| 56.0
| 15
| 20
| 72.1
|
1997 Jax Jag
| Mark Brunell
| 3,281
| 264
| 435
| 60.7
| 18
| 7
| 91.2
|
1983 LA Ram
| Vince Ferragamo
| 3,276
| 274
| 464
| 59.1
| 22
| 23
| 75.9
|
1997 Stl Ram
| Tony Banks
| 3,254
| 252
| 487
| 51.7
| 14
| 13
| 71.5
|
1968 Oak Rai
| Daryle Lamonica
| 3,245
| 206
| 416
| 49.5
| 25
| 15
| 80.9
|
1994 Phi Eagles
| Randall Cunningham
| 3,229
| 265
| 490
| 54.1
| 16
| 13
| 74.4
|
1984 NE Pats
| Tony Eason
| 3,228
| 259
| 431
| 60.1
| 23
| 8
| 93.4
|
1967 Oak Rai
| Daryle Lamonica
| 3,228
| 220
| 425
| 51.8
| 30
| 20
| 80.8
|
1980 LA Ram
| Vince Ferragamo
| 3,199
| 240
| 404
| 59.4
| 30
| 19
| 89.7
|
1993 Pho Cards
| Steve Beuerlein
| 3,164
| 258
| 418
| 61.7
| 18
| 17
| 82.5
|
1996 Dal Cwby
| Troy Aikman
| 3,126
| 296
| 465
| 63.7
| 12
| 13
| 80.1
|
2010 KC Chief
| Matt Cassel
| 3,116
| 262
| 450
| 58.2
| 27
| 7
| 93.0
|
1965 SF 49ers
| John Brodie
| 3,112
| 242
| 391
| 61.9
| 30
| 16
| 95.3
|
1991 Atl Fal
| Chris Miller
| 3,103
| 220
| 413
| 53.3
| 26
| 18
| 80.6
|
1993 Dal Cwby
| Troy Aikman
| 3,100
| 271
| 392
| 69.1
| 15
| 6
| 99.0
|
2009 Cin Beng
| Carson Palmer
| 3,094
| 282
| 466
| 60.5
| 21
| 13
| 83.6
|
1999 Jax Jag
| Mark Brunell
| 3,060
| 259
| 441
| 58.7
| 14
| 9
| 82.0
|
2006 Buf Bills
| J.P. Losman
| 3,051
| 268
| 429
| 62.5
| 19
| 14
| 84.9
|
2005 Was Rdskn
| Mark Brunell
| 3,050
| 262
| 454
| 57.7
| 23
| 10
| 85.9
|
1986 SD Chrg
| Dan Fouts
| 3,031
| 252
| 430
| 58.6
| 16
| 22
| 71.4
|
1968 SF 49ers
| John Brodie
| 3,020
| 234
| 404
| 57.9
| 22
| 21
| 78.0
|
1960 LA Chrg
| Jack Kemp
| 3,018
| 211
| 406
| 52.0
| 20
| 25
| 67.1
|
1997 Chi Bears
| Erik Kramer
| 3,011
| 275
| 477
| 57.7
| 14
| 14
| 74.0
|

10. Idaho
Per Capita Score: 248
3,000 Yard Passing Performances: 4
Those of us who remember watching Jake “The Snake” Plummer, remember watching a supremely gifted talent who never quite reached his full potential.
It is fair to say that when he was good, he was among the best, and when he was bad, it was difficult to watch.
Idaho 3,000 Yard Passing Performances
Year/Team
| Name
| Yds
| Cmp
| Att
| Cmp%
| TD
| Int
| Rtng
|
|---|---|---|---|---|---|---|---|---|
2004 Den Bronc
| Jake Plummer
| 4,089
| 303
| 521
| 58.2
| 27
| 20
| 84.5
|
1998 Ari Cards
| Jake Plummer
| 3,737
| 324
| 547
| 59.2
| 17
| 20
| 75.0
|
2001 Ari Cards
| Jake Plummer
| 3,653
| 304
| 525
| 57.9
| 18
| 14
| 79.6
|
2005 Den Bronc
| Jake Plummer
| 3,366
| 277
| 456
| 60.7
| 18
| 7
| 90.2
|
© 2014 Larry Rankin


