- HubPages»
- Sports and Recreation»
- Team Sports»
- American Football»
- NFL Football
AFL/NFL 1,000 Yard Receivers State by State Rank and Overview: Installment 1

The following database is a continued effort by the author to distinguish which U.S. states contribute the most to the game of American football. The focus of this section of the ongoing work is to determine the state by state rank for production of 1,000 yard receivers in AFL/NFL history.
To date the thousand yard receiving barrier has been broken 700 times by 269 different players. While in times past it was an epic feat, in recent years it has become much more commonplace, but regardless of current trends, the thousand yard season remains an accomplishment worthy of note.
As with the previous state by state football ranking articles this author has done, the state the player is attributed to is his state of birth. Also in keeping with the established format, there are two ranking systems: overall number of performances, in this case 1,000 yard receiving seasons, and per capita score.
In this case the per capita score is derived by dividing the state’s number of AFL/NFL 1,000 yard receivers by the state’s population, and then the zeros before the number are dropped to produce a visually more palatable score.
Below you will find the cumulative results of the data. On the left we have the per capita rank of each state. On the right we have the overall number of performances rank of each state.
The remainder of this database and subsequent links show the statistical data of every thousand yard receiver for each state in rank of per capita score.
References
The information for this database was compiled using the following sources: Profootballreference.com, NFL.com, and Wikipedia.com.
Feel free to help: If you find any of the information contained within this database to be misplaced or inaccurate, feel free to let the author know in the comments section. Not only is it not an annoyance, it is appreciated.
State Rank of 1,000 Yard Receiving Performances: Per Capita and Overall
Per Capita Rank
| Per Capita Score
| Overall No. Rank
| Number
|
|---|---|---|---|
1. Louisiana
| 1,016
| 1. Florida
| 86
|
2. Mississippi
| 836
| 2. Texas
| 81
|
3. Arkansas
| 541
| 3. California
| 71
|
4. West Virginia
| 539
| 4. Louisiana
| 47
|
5. Florida
| 439.83
| 5. Ohio
| 42
|
6. South Carolina
| 439.81
| 6. Michigan
| 41
|
7. Oklahoma
| 416
| 7. Pennsylvania
| 37
|
8. Michigan
| 414.3
| t8. Georgia
| 28
|
9. Alabama
| 413.8
| t8. North Carolina
| 28
|
10. Ohio
| 363
| 10. Mississippi
| 25
|
11. Texas
| 306
| 11. New Jersey
| 22
|
12. Pennsylvania
| 290
| 12. South Carolina
| 21
|
13. North Carolina
| 284
| t13. Alabama
| 20
|
14. Georgia
| 280
| t13. Virginia
| 20
|
15. New Jersey
| 247
| t15. Arkansas
| 16
|
16. Virginia
| 242
| t15. Oklahoma
| 16
|
17. Missouri
| 199
| 17. Missouri
| 12
|
18. California
| 185
| t18. Illinois
| 11
|
19. Minnesota
| 166
| t18. New York
| 11
|
20. New Mexico
| 144
| 20. West Virginia
| 10
|
21. North Dakota
| 138
| 21. Minnesota
| 9
|
22. Alaska
| 136
| t22. Maryland
| 6
|
23. Connecticut
| 111
| t22. Wisconsin
| 6
|
24. Wisconsin
| 104
| 24. Indiana
| 5
|
25. Maryland
| 101
| t25. Connecticut
| 4
|
26. Illinois
| 85
| t25. Tennessee
| 4
|
27. Indiana
| 76
| 27. New Mexico
| 3
|
28. Kansas
| 69
| t28. Arizona
| 2
|
29. Iowa
| 65
| t28. Iowa
| 2
|
30. Tennessee
| 62
| t28. Kansas
| 2
|
31. New York
| 56
| t28. Massachusetts
| 2
|
32. Oregon
| 51
| t28. Oregon
| 2
|
33. Utah
| 34
| t28. Washington
| 2
|
34. Arizona
| 30.2
| t34. Alaska
| 1
|
35. Massachusetts
| 29.9
| t34. Kentucky
| 1
|
36. Washington
| 29
| t34. North Dakota
| 1
|
37. Kentucky
| 23
| t34. Utah
| 1
|
Tom Fears, born in Guadalajara, Mexico, is the only non-U.S. born player to have a 1,000 yard receiving season, a feat he accomplished twice. 13 states have yet to have a l,000 yard receiver.

1. Louisiana
Per Capita Score: 1,016
1,000 Yard Performances: 47
Coming in first by a substantial amount in per capita score is Louisiana. Studying the data, you’ll notice that Louisiana is not a one trick pony. They have continually produced great receivers throughout the history of the sport.
Their most substantial contributor is Reggie Wayne, with 8 thousand yard seasons.
Louisiana: 1,000 Yard Receiving Performances
Year/Team
| Name
| Pos
| Yds
| Rec
| Avg
| TD
| Lg
|
|---|---|---|---|---|---|---|---|
1961 Hou Oilers
| Charley Hennigan
| WR
| 1,746
| 82
| 21.3
| 12
| 80
|
1964 Hou Oilers
| Charley Hennigan
| WR
| 1,546
| 101
| 15.3
| 8
| 53
|
2007 Ind Colts
| Reggie Wayne
| WR
| 1,510
| 104
| 14.5
| 10
| 64
|
1989 TB Bucs
| Mark Carrier
| WR
| 1,422
| 86
| 16.5
| 9
| 78
|
2012 TB Bucs
| Vincent Jackson
| WR
| 1,384
| 72
| 19.2
| 8
| 95
|
2010 Ind Colts
| Reggie Wayne
| WR
| 1,355
| 111
| 12.2
| 6
| 50
|
2012 Ind Colts
| Reggie Wayne
| WR
| 1,355
| 106
| 12.8
| 5
| 33
|
1986 Mia Dolphins
| Mark Duper
| WR
| 1,313
| 67
| 19.6
| 11
| 85
|
2006 Ind Colts
| Reggie Wayne
| WR
| 1,310
| 86
| 15.2
| 9
| 51
|
1984 Mia Dolphins
| Mark Duper
| WR
| 1,306
| 71
| 18.4
| 8
| 80
|
1966 Det Lions
| Pat Studstill
| WR
| 1,266
| 67
| 18.9
| 5
| 99
|
2009 Ind Colts
| Reggie Wayne
| WR
| 1,264
| 100
| 12.6
| 10
| 65
|
1969 Oak Raiders
| Warren Wells
| WR
| 1,260
| 47
| 26.8
| 14
| 80
|
2010 Pit Steelers
| Mike Wallace
| WR
| 1,257
| 60
| 21.0
| 10
| 56
|
1981 Buf Bills
| Frank Lewis
| WR
| 1,244
| 70
| 17.8
| 4
| 33
|
2013 TB Bucs
| Vincent Jackson
| WR
| 1,224
| 78
| 15.7
| 7
| 60
|
2004 Ind Colts
| Reggie Wayne
| WR
| 1,210
| 77
| 15.7
| 12
| 71
|
1996 Bal Ravens
| Michael Jackson
| WR
| 1,201
| 76
| 15.8
| 14
| 86
|
2004 TB Bucs
| Michael Clayton
| WR
| 1,193
| 80
| 14.9
| 7
| 75
|
2011 Pit Steelers
| Mike Wallace
| WR
| 1,193
| 72
| 16.6
| 8
| 95
|
2002 Chic Bears
| Marty Booker
| WR
| 1,189
| 97
| 12.3
| 6
| 54
|
1981 SD Chargers
| Charlie Joiner
| WR
| 1,188
| 70
| 17.0
| 7
| 57
|
2009 SD Chargers
| Vincent Jackson
| WR
| 1,167
| 68
| 17.2
| 9
| 55
|
2008 Ind Colts
| Reggie Wayne
| WR
| 1,145
| 82
| 14.0
| 6
| 65
|
1968 Oak Raiders
| Warren Wells
| WR
| 1,137
| 53
| 21.5
| 11
| 94
|
1985 Pit Steelers
| Louis Lipps
| WR
| 1,134
| 59
| 19.2
| 12
| 51
|
1980 SD Chargers
| Charlie Joiner
| WR
| 1,132
| 71
| 15.9
| 4
| 51
|
1991 Atl Falcons
| Michael Haynes
| WR
| 1,122
| 50
| 22.4
| 11
| 80
|
2011 SD Chargers
| Vincent Jackson
| WR
| 1,106
| 60
| 18.4
| 9
| 58
|
2005 KC Chiefs
| Eddie Kennison
| WR
| 1,102
| 68
| 16.2
| 5
| 55
|
2008 SD Chargers
| Vincent Jackson
| WR
| 1,098
| 59
| 18.6
| 7
| 60
|
2004 KC Chiefs
| Eddie Kennison
| WR
| 1,086
| 62
| 17.5
| 8
| 70
|
1991 Mia Dolphins
| Mark Duper
| WR
| 1,085
| 70
| 15.5
| 5
| 43
|
1979 Buff Bills
| Frank Lewis
| WR
| 1,082
| 54
| 20.0
| 2
| 55
|
2001 Chi Bears
| Marty Booker
| WR
| 1,071
| 100
| 10.7
| 8
| 66
|
1976 SD Chargers
| Charlie Joiner
| WR
| 1,056
| 50
| 21.1
| 7
| 81
|
2005 Ind Colts
| Reggie Wayne
| WR
| 1,055
| 83
| 12.7
| 5
| 66
|
1963 Hou Oilers
| Charley Hennigan
| WR
| 1,051
| 61
| 17.2
| 10
| 68
|
1999 Stl Rams
| Marshall Faulk
| RB
| 1,048
| 87
| 12.0
| 5
| 57
|
1981 Stl Cardinals
| Pat Tilley
| WR
| 1,040
| 66
| 15.8
| 3
| 75
|
1961 SF 49ers
| R.C. Owens
| WR
| 1,032
| 55
| 18.8
| 5
| 54
|
1990 KC Chiefs
| Stephone Paige
| WR
| 1,021
| 65
| 15.7
| 5
| 86
|
1979 Atl Falcons
| Wallace Francis
| WR
| 1,013
| 74
| 13.7
| 8
| 42
|
1979 SD Cargers
| Charlie Joiner
| WR
| 1,008
| 72
| 14.0
| 4
| 39
|
1983 Mia Dolphins
| Mark Duper
| WR
| 1,003
| 51
| 19.7
| 10
| 85
|
1995 Car Panthers
| Mark Carrier
| WR
| 1,002
| 66
| 15.0
| 3
| 66
|
1981 Min Vikings
| Sammy White
| WR
| 1,001
| 66
| 15.2
| 3
| 53
|
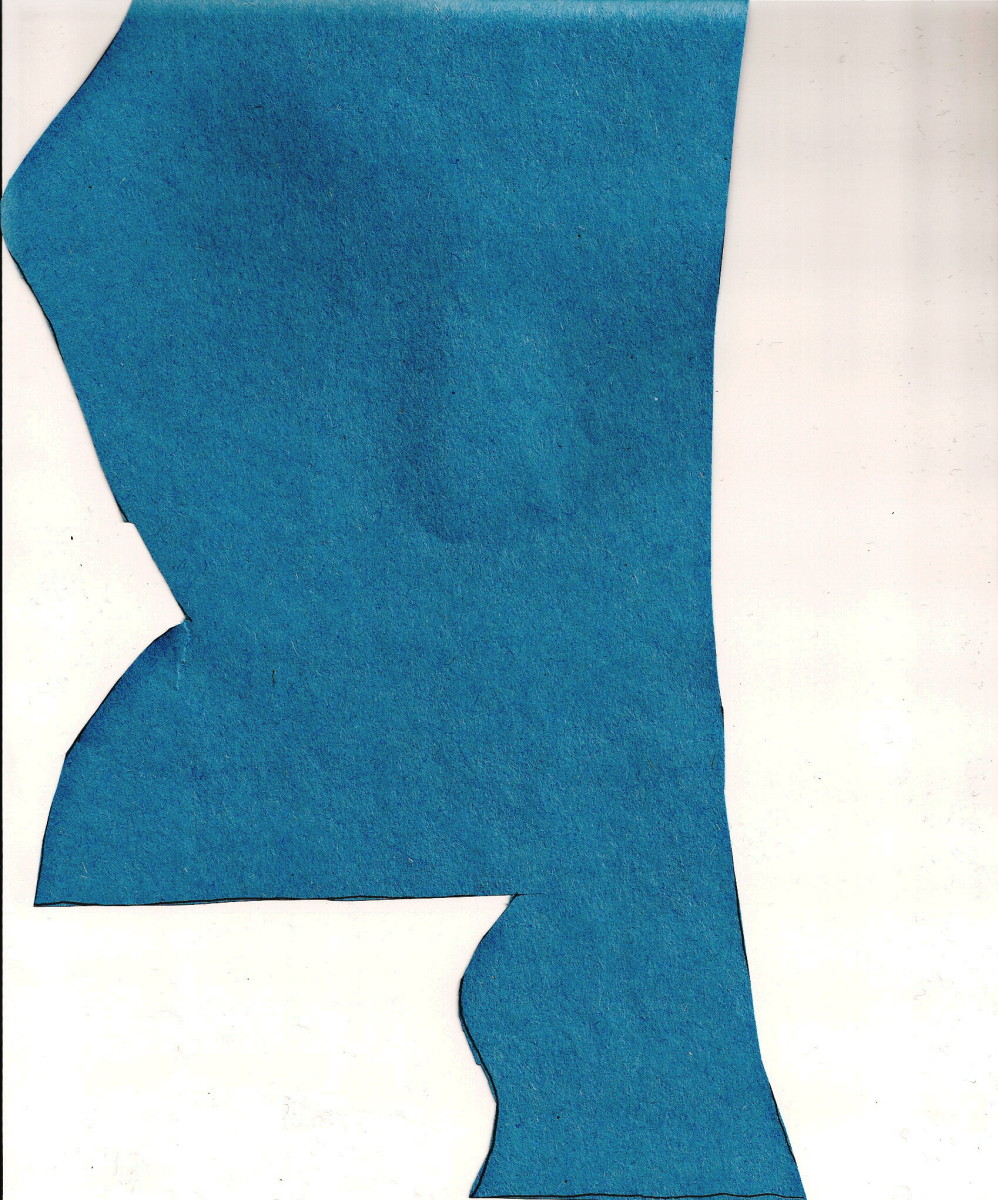
2. Mississippi
Per Capita Score: 836
1,000 Yard Performances: 25
In a per capita scoring system such as this, it doesn’t hurt to be the birth state of Jerry Rice, especially if the state in question happens to be populated by fewer than 3 million people.
Rice’s NFL record 14 thousand yard receiving performances makes up the lion’s share of Mississippi’s list of thousand yard receivers, though there are other solid contributors such as Eric Moulds and Harold Jackson.
Mississippi: 1,000 Yard Receiving Performances
Year/Team
| Name
| Pos
| Yds
| Rec
| Avg
| TD
| Lg
|
|---|---|---|---|---|---|---|---|
1995 SF 49ers
| Jerry Rice
| WR
| 1,848
| 122
| 15.1
| 15
| 81
|
1986 SF 49ers
| Jerry Rice
| WR
| 1,570
| 86
| 18.3
| 15
| 66
|
1993 SF 49ers
| Jerry Rice
| WR
| 1,503
| 98
| 15.3
| 15
| 80
|
1990 SF 49ers
| Jerry Rice
| WR
| 1,502
| 100
| 15.0
| 13
| 64
|
1994 SF 49ers
| Jerry Rice
| WR
| 1,499
| 112
| 13.4
| 13
| 69
|
1989 SF 49ers
| Jerry Rice
| WR
| 1483
| 82
| 18.1
| 17
| 68
|
1998 Buf Bills
| Eric Moulds
| WR
| 1,368
| 67
| 20.4
| 9
| 84
|
2000 Buf Bills
| Eric Moulds
| WR
| 1,326
| 94
| 14.1
| 5
| 52
|
1988 SF 49ers
| Jerry Rice
| WR
| 1,306
| 64
| 20.4
| 9
| 96
|
2002 Buf Bills
| Eric Moulds
| WR
| 1,292
| 100
| 12.9
| 10
| 70
|
1996 SF 49ers
| Jerry Rice
| WR
| 1,254
| 108
| 11.6
| 8
| 39
|
2002 Oak Raiders
| Jerry Rice
| WR
| 1,211
| 92
| 13.2
| 7
| 75
|
1991 SF 49ers
| Jerry Rice
| WR
| 1,206
| 80
| 15.1
| 14
| 73
|
1967 Stl Cardinals
| Jackie Smith
| TE
| 1,205
| 56
| 21.5
| 9
| 76
|
1992 SF 49ers
| Jerry Rice
| WR
| 1,201
| 84
| 14.3
| 10
| 80
|
1998 SF 49ers
| Jerry Rice
| WR
| 1,157
| 82
| 14.1
| 9
| 75
|
1983 NY Giants
| Earnest Gray
| WR
| 1,139
| 78
| 14.6
| 5
| 62
|
2001 Oak Raiders
| Jerry Rice
| WR
| 1,139
| 83
| 13.7
| 9
| 40
|
1994 Phi Eagles
| Fred Barnett
| WR
| 1,127
| 78
| 14.4
| 5
| 54
|
1969 Phi Eagles
| Harold Jackson
| WR
| 1,116
| 65
| 17.2
| 9
| 65
|
1992 Phi Eagles
| Fred Barnett
| WR
| 1,083
| 67
| 16.2
| 6
| 71
|
1987 SF 49ers
| Jerry Rice
| WR
| 1,078
| 65
| 16.6
| 22
| 57
|
1972 Phi Eagles
| Harold Jackson
| WR
| 1,048
| 62
| 16.9
| 4
| 77
|
2004 Buf Bills
| Eric Moulds
| WR
| 1,043
| 88
| 11.9
| 5
| 49
|
1979 NE Patriots
| Harold Jackson
| WR
| 1,013
| 45
| 22.5
| 7
| 59
|

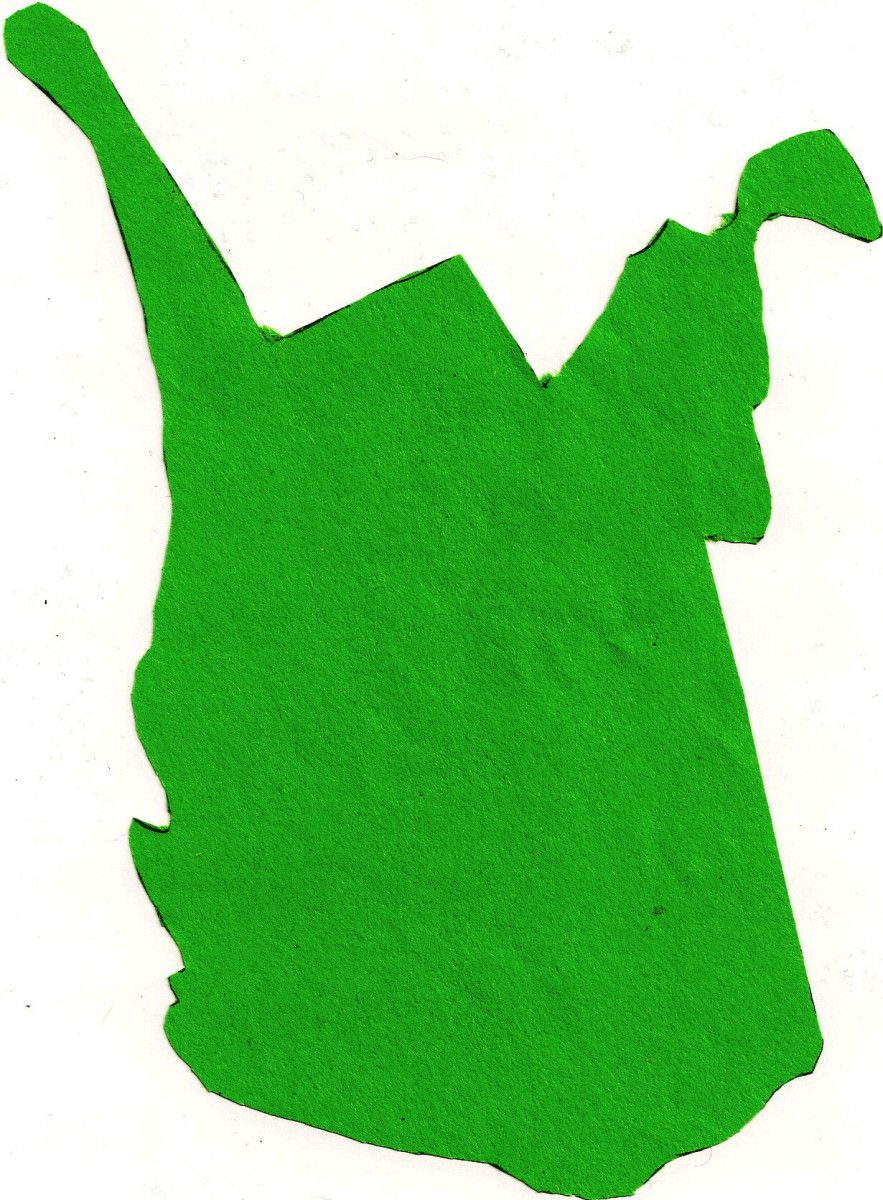
3. Arkansas
Per Capita Score: 541
1,000 Yard Performances: 16
From second to third we have roughly a 300 point drop off. Arkansas’s most substantial contributor is Rod Smith, with 8 thousand yard performances.
It is also of note that the 1,000 yard receiving season, in a sense, was invented by an Arkansas born player. Don Hutson’s 1,211 yards receiving in 1942 marked the first time the 1,000 yard plateau was eclipsed by a receiver.
Arkansas: 1,000 Yard Receiving Performances
Year/Team
| Name
| Pos
| Yds
| Rec
| Avg
| TD
| Lg
|
|---|---|---|---|---|---|---|---|
2000 Den Broncos
| Rod Smith
| WR
| 1,602
| 100
| 16.0
| 8
| 49
|
1984 Stl Cardinals
| Roy Green
| WR
| 1,555
| 78
| 19.9
| 12
| 83
|
1963 Was Redskins
| Bobby Mitchell
| WR
| 1,436
| 69
| 20.8
| 7
| 99
|
1962 Was Redskins
| Bobby Mitchell
| WR
| 1,384
| 72
| 19.2
| 11
| 81
|
2001 Den Broncos
| Rod Smith
| WR
| 1,343
| 113
| 11.9
| 11
| 65
|
1983 Stl Cardinals
| Roy Green
| WR
| 1,227
| 78
| 15.7
| 14
| 71
|
1998 Den Broncos
| Rod Smith
| WR
| 1,222
| 86
| 14.2
| 6
| 58
|
1942 GB Packers
| Don Hutson
| WR
| 1,211
| 74
| 16.4
| 17
| 73
|
1997 Den Broncos
| Rod Smith
| WR
| 1,180
| 70
| 16.9
| 12
| 78
|
2004 Den Broncos
| Rod Smith
| WR
| 1,144
| 79
| 14.5
| 7
| 85
|
2005 Den Broncos
| Rod Smith
| WR
| 1,105
| 85
| 13.0
| 6
| 72
|
1988 Pho Cardinals
| Roy Green
| WR
| 1,097
| 68
| 16.1
| 7
| 52
|
1945 Cle Rams
| Jim Benton
| WR
| 1,067
| 45
| 23.7
| 8
| 84
|
2002 Den Broncos
| Rod Smith
| WR
| 1,027
| 89
| 11.5
| 5
| 46
|
1981 Det Lions
| Freddie Scott
| WR
| 1,022
| 53
| 19.3
| 5
| 48
|
1999 Den Broncos
| Rod Smith
| WR
| 1,020
| 79
| 12.9
| 4
| 71
|
4. West Virginia
Per Capita Score: 539
1,000 Yard Performances: 10
West Virginia is fourth because they have less than 2 million people, and one of them happened to be Randy Moss.
There really isn’t much else to say here. Moss’s brilliant career and 10 thousand yard performances take West Virginia from a no-show to a fourth place contender on our per capita list.
West Virginia: 1,000 Yard Receiving Performances
Year/Team
| Name
| Pos
| Yds
| Rec
| Avg
| TD
| Lg
|
|---|---|---|---|---|---|---|---|
2003 Min Vikings
| Randy Moss
| WR
| 1,632
| 111
| 14.7
| 17
| 72
|
2007 NE Patriots
| Randy Moss
| WR
| 1,493
| 98
| 15.2
| 23
| 65
|
2000 Min Vikings
| Randy Moss
| WR
| 1,437
| 77
| 18.7
| 15
| 78
|
1999 Min Vikings
| Randy Moss
| WR
| 1,413
| 80
| 17.7
| 11
| 67
|
2002 Min Vikings
| Randy Moss
| WR
| 1,347
| 106
| 12.7
| 7
| 60
|
1998 Min Vikings
| Randy Moss
| WR
| 1,313
| 69
| 19.0
| 17
| 61
|
2009 NE Patriots
| Randy Moss
| WR
| 1,264
| 83
| 15.2
| 13
| 71
|
2001 Min Vikings
| Randy Moss
| WR
| 1,233
| 82
| 15.0
| 10
| 73
|
2008 NE Patriots
| Randy Moss
| WR
| 1,008
| 69
| 14.6
| 11
| 76
|
2005 Oak Raiders
| Randy Moss
| WR
| 1,005
| 60
| 16.8
| 8
| 79
|
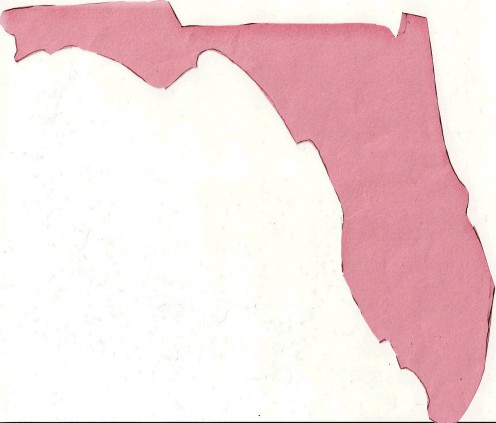
5. Florida
Per Capita Score: 439.83
1,000 Yard Performances: 86
By the slimmest of margins, Florida comes in fifth on our per capita list. In fact, with discrepancies in census numbers, it is just as likely that South Carolina belongs in this spot as Florida.
Florida’s 86 thousand yard performances ranks first above Texas by 5 in overall number, and Florida’s list of receivers include many of the all-time greats: Michael Irvin, Isaac Bruce, and Andre Johnson just to name a few.
Florida: 1,000 Yard Receiving Performances
Year/Team
| Name
| Pos
| Yds
| Rec
| Avg
| TD
| Lg
|
|---|---|---|---|---|---|---|---|
1995 Stl Rams
| Isaac Bruce
| WR
| 1,781
| 119
| 15.0
| 13
| 72
|
1995 Dal Cowboys
| Michael Irvin
| WR
| 1,603
| 111
| 14.4
| 10
| 50
|
2012 Hou Texans
| Andre Johnson
| WR
| 1,598
| 112
| 14.3
| 4
| 60
|
2008 Hou Texans
| Andre Johnson
| WR
| 1,575
| 115
| 13.7
| 8
| 65
|
2009 Hou Texans
| Andre Johnson
| WR
| 1,569
| 101
| 15.5
| 9
| 72
|
1991 Dal Cow
| Michael Irvin
| WR
| 1,523
| 93
| 16.4
| 8
| 66
|
2013 Pit Steelers
| Antonio Brown
| WR
| 1,499
| 110
| 13.6
| 8
| 56
|
1995 Det Lions
| Brett Perriman
| WR
| 1,488
| 108
| 13.8
| 9
| 91
|
2005 Was Redskins
| Santana Moss
| WR
| 1,483
| 84
| 17.7
| 9
| 78
|
2000 Stl Rams
| Isaac Bruce
| WR
| 1,471
| 87
| 16.9
| 9
| 78
|
2007 Cin Bengals
| Chad Johnson
| WR
| 1,440
| 93
| 15.5
| 8
| 70
|
2005 Cin Bengals
| Chad Johnson
| WR
| 1,432
| 97
| 14.8
| 9
| 70
|
2013 Hou Texans
| Andre Johnson
| WR
| 1,407
| 109
| 12.9
| 5
| 62
|
2005 Ari Cardinals
| Anquan Boldin
| WR
| 1,402
| 102
| 13.7
| 7
| 54
|
1992 Dal Cowboys
| Michael Irvin
| WR
| 1,396
| 78
| 17.9
| 7
| 87
|
2003 Ari Cardinals
| Anquan Boldin
| WR
| 1,377
| 101
| 13.6
| 8
| 71
|
2006 Cin Bengals
| Chad Johnson
| WR
| 1,369
| 87
| 15.7
| 7
| 74
|
2003 Cin Bengals
| Chad Johnson
| WR
| 1,355
| 90
| 15.1
| 10
| 82
|
1983 KC Chiefs
| Carlos Carson
| WR
| 1,351
| 80
| 16.9
| 7
| 50
|
2013 Was Redskins
| Pierre Garcon
| WR
| 1,346
| 113
| 11.9
| 5
| 53
|
1996 Stl Rams
| Isaac Bruce
| WR
| 1,338
| 84
| 15.9
| 7
| 70
|
1993 Dal Cowboys
| Michael Irvin
| WR
| 1,330
| 88
| 15.1
| 7
| 61
|
2004 Stl Rams
| Isaac Bruce
| WR
| 1,292
| 89
| 14.5
| 6
| 56
|
2004 Cin Bengals
| Chad Johnson
| WR
| 1,274
| 95
| 13.4
| 9
| 53
|
1988 Cin Bengals
| Eddie Brown
| WR
| 1,273
| 53
| 24.0
| 9
| 86
|
2002 NY Jets
| Laveranues Coles
| WR
| 1,264
| 89
| 14.2
| 5
| 43
|
2008 TB Bucs
| Antonio Bryant
| WR
| 1,248
| 83
| 15.0
| 7
| 71
|
2009 Pit Steelers
| Santonio Holmes
| WR
| 1,248
| 79
| 15.8
| 5
| 57
|
1994 Dal Cowboys
| Michael Irvin
| WR
| 1,241
| 79
| 15.7
| 6
| 65
|
1966 Dal Cowboys
| Bob Hayes
| WR
| 1,232
| 64
| 19.3
| 13
| 95
|
1988 Min Vikings
| Anthony Carter
| WR
| 1,225
| 72
| 17.0
| 6
| 67
|
1995 SD Chargers
| Tony Martin
| WR
| 1,224
| 90
| 13.6
| 6
| 51
|
2010 Hou Texans
| Andre Johnson
| WR
| 1,216
| 86
| 14.1
| 8
| 60
|
2003 Was Redskins
| Laveranues Coles
| WR
| 1,204
| 82
| 14.7
| 6
| 64
|
2006 Ari Cardinals
| Anquan Boldin
| WR
| 1,203
| 83
| 14.5
| 4
| 64
|
1985 SD Chargers
| Wes Chandler
| WR
| 1,199
| 67
| 17.9
| 10
| 75
|
1998 Atl Falcons
| Tony Martin
| WR
| 1,181
| 66
| 17.9
| 6
| 62
|
1997 Dal Cowboys
| Michael Irvin
| WR
| 1,180
| 75
| 15.7
| 9
| 55
|
2013 SF 49ers
| Anquan Boldin
| WR
| 1,179
| 85
| 13.9
| 7
| 63
|
1996 SD Chargers
| Tony Martin
| WR
| 1,171
| 85
| 13.8
| 14
| 55
|
2002 Cin Bengals
| Chad Johnson
| WR
| 1,166
| 69
| 16.9
| 5
| 72
|
1999 Stl Rams
| Isaac Bruce
| WR
| 1,165
| 77
| 15.5
| 12
| 60
|
2010 KC Chiefs
| Dwayne Bowe
| WR
| 1,162
| 72
| 16.1
| 15
| 75
|
2011 KC Chiefs
| Dwayne Bowe
| WR
| 1,159
| 81
| 14.3
| 5
| 52
|
2006 Hou Texans
| Andre Johnson
| WR
| 1,147
| 103
| 11.1
| 5
| 53
|
1998 Ari Cardinals
| Frank Sanders
| WR
| 1,145
| 89
| 12.9
| 3
| 42
|
1981 NO/SD
| Wes Chandler
| WR
| 1,142
| 69
| 16.6
| 6
| 51
|
2004 How Texans
| Andre Johnson
| WR
| 1,142
| 79
| 14.5
| 6
| 54
|
1999 Was Redskins
| Albert Connell
| WR
| 1,132
| 62
| 18.3
| 7
| 62
|
1973 Phi Eagles
| Harold Carmichael
| WR
| 1,116
| 67
| 16.7
| 9
| 73
|
2010 Was Redskins
| Santana Moss
| WR
| 1,115
| 93
| 12.0
| 6
| 56
|
2011 Pit Steelers
| Antonio Brown
| WR
| 1,108
| 69
| 16.1
| 2
| 79
|
2001 Stl Rams
| Isaac Bruce
| WR
| 1,106
| 64
| 17.3
| 6
| 51
|
2003 NY Jets
| Santana Moss
| WR
| 1,105
| 74
| 14.9
| 10
| 65
|
2006 Stl Rams
| Isaac Bruce
| WR
| 1,098
| 74
| 14.8
| 3
| 45
|
2006 NY Jets
| Laveranues Coles
| WR
| 1,098
| 91
| 12.1
| 6
| 58
|
1994 Sea Seahawks
| Brian Blades
| WR
| 1,086
| 81
| 13.4
| 4
| 45
|
2013 Ind Colts
| T.Y. Hilton
| WR
| 1,083
| 82
| 13.2
| 5
| 73
|
1984 KC Chiefs
| Carlos Carson
| WR
| 1,078
| 57
| 18.9
| 4
| 67
|
2002 Stl Rams
| Isaac Bruce
| WR
| 1,075
| 79
| 13.6
| 7
| 34
|
1978 Phi Eagles
| Harold Carmichael
| WR
| 1,072
| 55
| 19.5
| 8
| 56
|
1979 NO Saints
| Wes Chandler
| WR
| 1,069
| 65
| 16.4
| 6
| 85
|
1989 Was Redskins
| Anthony Carter
| WR
| 1,066
| 65
| 16.4
| 4
| 50
|
1989 Sea Seahawks
| Brian Blades
| WR
| 1,063
| 77
| 13.8
| 5
| 60
|
1975 Hou Oilers
| Ken Burrough
| WR
| 1,063
| 53
| 20.1
| 8
| 77
|
1986 Hou Oilers
| Ernest Givins
| WR
| 1,062
| 61
| 17.4
| 3
| 60
|
1998 Dal Cowboys
| Michael Irvin
| WR
| 1,057
| 74
| 14.3
| 1
| 51
|
1953 Phi Eagles
| Pete Pihos
| WR
| 1,049
| 63
| 16.7
| 10
| 59
|
2009 Cin Bengals
| Chad Johnson
| WR
| 1,047
| 72
| 14.5
| 9
| 50
|
2001 NO Saints
| Willie Jackson
| WR
| 1,046
| 81
| 12,9
| 5
| 63
|
1987 KC Chiefs
| Carlos Carson
| WR
| 1,044
| 55
| 19.0
| 7
| 81
|
2008 Was Redskins
| Santana Moss
| WR
| 1,044
| 79
| 13.2
| 6
| 67
|
2008 Ari Cardinals
| Anquan Boldin
| WR
| 1,038
| 89
| 11.7
| 11
| 79
|
1999 Mia Dolphins
| Tony Martin
| WR
| 1,037
| 67
| 15.5
| 5
| 69
|
1982 SD Chargers
| Wes Chandler
| WR
| 1,032
| 49
| 21.1
| 9
| 66
|
1981 Phi Eagles
| Harold Carmichael
| WR
| 1,028
| 61
| 16.9
| 6
| 85
|
2009 Ari Cardinal
| Anquan Boldin
| WR
| 1,024
| 84
| 12.2
| 4
| 44
|
2008 KC Chiefs
| Dwayne Bowe
| WR
| 1,022
| 86
| 11.9
| 7
| 36
|
1996 Det Lions
| Brett Perriman
| WR
| 1,021
| 94
| 10.9
| 5
| 44
|
1997 Ari Cardinals
| Frank Sanders
| WR
| 1,017
| 75
| 13.6
| 4
| 70
|
2005 Cle Browns
| Antonio Bryant
| WR
| 1,009
| 69
| 14.6
| 4
| 54
|
1990 Min Vikings
| Anthony Carter
| WR
| 1,008
| 70
| 14.4
| 8
| 56
|
2002 Was Redskins
| Rod Gardner
| WR
| 1,006
| 71
| 11.5
| 8
| 43
|
1991 Sea Seahawks
| Brian Blades
| WR
| 1,003
| 70
| 14.3
| 2
| 52
|
1965 Dal Cowboys
| Bob Hayes
| WR
| 1,003
| 46
| 21.8
| 12
| 82
|
1995 Sea Seahawks
| Brian Blades
| WR
| 1,001
| 77
| 13.0
| 4
| 49
|
© 2014 Larry Rankin