- HubPages»
- Sports and Recreation»
- Team Sports»
- Baseball
Grading Managers' Usage of the Intentional Walk
Up Front: My Take on the Intentional Walk
In my opinion, intentional walks are always foolish. They might provide some sort of protection from going against a certain batter, but court danger – often in many different ways.
For one thing, I think the IBB was formerly primarily used as a way to avoid dangerous hitters. These days, it seems they are often used to improve lefty/righty matchups or force a pinch-hitter to enter – and that frequently means not only putting a runner on, but losing a pitcher and then ending up with a matchup that, to an outside observer, hardly seems so much better as to risk an extra runner and lose a pitcher in the bargain.
But, no matter your take on the ol’ IBB, it is clear that sometimes it works and sometimes it doesn’t. Instead of comparing to some imaginary baseline, let’s compare managers to each other. Trying to quantify that, however, is not easy.

What Could Go Wrong? Rogers' Debacle
- Kenny Rogers Walks Andruw Jones Sending Braves To World Series - YouTube
- Ten Years Later, Baseball's Only Playoff Walkoff Walk Still Delights - Walkoff Walk
Kenny Rogers' four-pitch debacle following a pair of intentional walks -- something which still haunts Mets fans.
Trying to Evaluate the IBB
For one thing, there really isn’t a control group. The specific matchup of pitcher and batter? Not enough. What’s the inning and score? There’s a huge difference between facing a veteran pitcher who has thrown 23 pitches and is up by three runs with no one on base during a cold day in April and challenging him after 102 pitches in a 1-run game in the eighth with two men on and a sweltering August day in Texas.
Then there’s the lineup and bullpen factor. Who is batting behind the player? And who is batting behind him? Who is on base? Is it two speedy guys or a slowpoke? Is there a strong lefty in the bullpen raring to go or just a pair of tired righties?
And then there’s the fact that while the next batter is the one the manager is preparing to face (unless he is walked intentionally, too), the result of that encounter is often only part of the final result of the inning. A mistake that is compounded, particularly with two out, can be blamed at least in part on the IBB.
So, what’s to be done? How do you compare the situations and the short-term and long-term results? I think there is no clear-cut answer, but I’ve got a solution of sorts.
A few years back I toyed with what I called “situational calculus.” It was a crude system, but a nice method to evaluate clutch hitting in an inning’s context. Except that it didn’t take into account the score. Thankfully, someone did the hard work of coming up with a better method to establish the situational… um, situation.
Win Probability measures the eventual winning team’s odds of winning through each event in the game. For each at bat, stolen base, etc., the number changes. (Not sure what it does with tie games.) It takes the score, outs and runners on into account and, using the current rate of success or failure of MLB teams in scoring runs in those situations, tries to establish the likelihood of the eventual winner winning.
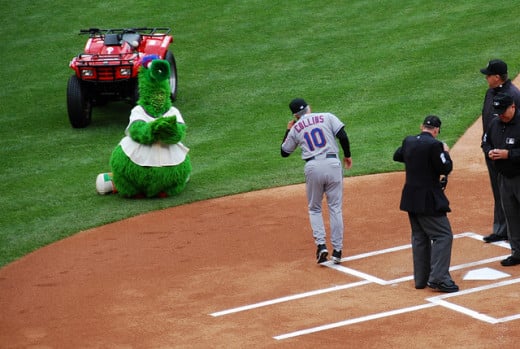
What I love about it is that WP recognizes that you deserve minimal credit for stranding the eighth hitter if you retire the pitcher in the second inning of a tie game or blame if your IBB backfires when you already trail 10-3. It gives you plenty of credit if you do get that potential game-saving double play in the ninth inning or blame if, like Terry Collins, you tend to get a walkoff loss because you put a man on base in a very winnable situation.
Using Win Probability to Rate the IBB
Rating changes to WP on the IBB alone is pointless. If, however, you compare the pre-IBB to the post-next batter figure, you get some idea of whether or not the manager’s strategy worked in the short-term. I call this the tactical situation and tactical score.
What if there is a tactical failure and the inning slips away? Or what if, following a successful tactical result, there’s still another out to get? I believe that an IBB alters the rest of the inning. How it goes is also on the manager’s head. Comparing the pre-IBB WP to the end result of the inning’s WP provides what I call the strategic score.
You could argue that each manager has a different roster, situation that they choose to use the IBB in and so on. And, of course, WP doesn’t distinguish between a lefty against Albert Pujols and a righty against Rey Ordonez. True. But what every manager wants to do is win. And, regardless of who is batting or pitching or on deck, when the inning ends, WP accurately reflects the general likelihood of a team winning. And that is what managers play for. The tactical choices are supposed to help them get there, and if WP doesn’t quite calculate with the exact players involved, the manager’s intelligence and choices are supposed to help him improve his team’s odds and put WP back into alignment with his side.
And a manager is never forced into an IBB. Whether he’s patting himself on the back for outthinking the other guy or desperately hopes to get a double play, if he does it, it is to improve his team’s odds of winning.
The Best of the Best

Ranking the Managers
Through June 28, every manager used at least seven IBBs this year. Ned Yost, Brad Ausmus and John Farrell were the least likely to offer a free pass, followed by Ron Roenicke (eight) and Ron Gardenhire (nine).
The walker-friendly managers included Ryne Sandberg (27), Mike Redmond (25), Terry Francona (25), Terry Collins (24) and Clint Hurdle (22).
The best tactical scores belong to Sandberg (+107) – nice learning curve, new guy – Bob Melvin (+66), Mike Scioscia (+62), Roenicke (+58) and Joe Maddon (+52).
The worst tactical scores belong to Collins (-115), Ron Washington (-66), Francona (-55), Lloyd McClendon (-53) and Robin Ventura (-50).
Interestingly, the best and worst tactical users – each by far – are among the busiest users of the IBB. When it is Sandberg, you’ve got reason to believe it’s the right course. When it’s Collins… good luck, Mets fans. Francona isn’t much better. Roenicke has done well in his limited selections.
Strategically, the best scores belong to Roenicke (+91), Sandberg (+86), Hurdle (+77), Bo Porter (+74) and Maddon (+66). It is safe to say Roenicke’s few choices and Sandberg’s many are the best overall so far, with Maddon also in the running. Hurdle does well at both. Porter… well, I’ll get to that.
The worst are Collins (-71), Joe Girardi (-69), Washington (-66), Mike Matheny (-62_ and Bryan Price (-62).
Girardi was also negative tactically. New York managers struggle to handle the IBB. Amazingly, Collins was helped by my delay in finishing collecting the data. Between my original calculations and when I finished, he had a very good result. He had negative triple digits in both categories as of June 10.
Washington rates bottom five in both. Matheny and Price aren’t too bad tactically, but have trouble looking ahead, like Girardi (as I have always screamed at the TV).
Don Mattingly is almost neutral in both categories.
The Managers by the Numbers
Name
| IBBs
| Tactical
| Strategic
|
|---|---|---|---|
Sandberg
| 27
| +107
| +86
|
Redmond
| 25
| +38
| +19
|
Francona
| 25
| -55
| -18
|
Collins
| 24
| -115
| -71
|
Hurdle
| 22
| +43
| +77
|
Gibson
| 20
| +34
| -42
|
Renteria
| 19
| +14
| +30
|
Washington
| 17
| -66
| -66
|
Scioscia
| 17
| +62
| +27
|
Price
| 17
| -15
| -62
|
Matheny
| 17
| -11
| -62
|
Mattingly
| 17
| -6
| -1
|
Porter
| 16
| -40
| +74
|
Williams
| 16
| -18
| -28
|
Gonzalez
| 16
| -49
| -32
|
Black
| 16
| +40
| +42
|
Maddon
| 15
| +52
| +66
|
Ventura
| 14
| -50
| -25
|
Weiss
| 14
| -17
| -45
|
Showalter
| 14
| -18
| +46
|
McClendon
| 14
| -53
| -51
|
Bochy
| 14
| +41
| +25
|
Melvin
| 13
| +66
| +51
|
Girardi
| 13
| -27
| -69
|
Gibbons
| 10
| -24
| -6
|
Gardenhire
| 9
| +12
| +14
|
Roenicke
| 8
| +58
| +91
|
Yost
| 7
| -11
| -15
|
Ausmus
| 7
| -37
| -7
|
Farrell
| 7
| +17
| -10
|
Bo Porter, Psychic

Differences Between Tactics and Strategy
Bo Porter, in his 16 IBBs, really has had a tough time with tactical choices. They have more often than not hurt his team. Yet he has had amazing foresight for a guy who can’t get past the next batter. Porter has an improvement of 114 points between his tactical and strategic choices. He has seven positive, one neutral and nine negative results tactically, for -40. He has nine positive, two neutral and six negative results strategically, for +74.
Showalter and Collins have the next best improvements, of 64 and 44 points. Showalter flips from mildly negative to fairly solidly positive. Collins, however, remains awful.
Kirk Gibson does the worst, dropping 76 points and going from solidly positive to solidly negative, despite going from 13 positive results, six negative and one neutral to 12, six and two. Matheny (-51), Price (-47) and Girardi (-42) also look better on first glance than they do when the inning ends.
I suspect some managers focus so much on getting the one good matchup that they forget how they might be painting themselves into a corner. Others really think ahead, like in a chess match.
The Worst of the Worst

The Big Gamble
I’ve made my own opinion clear, that the IBB is a foolish decision at all times. That being said, it still exists, and every manager uses it. So, what should a manager expect? I’m not going to fully analyze that data just yet (there’s too much to parse for me to really do that properly right now), but I’ve noticed something interesting.
Tactically, 278 walks worked and 171 didn’t, with 21 neutral. Sounds good for the IBB. Among those who did really well, Scioscia was 13-2-2 (positive, neutral, negative), Sandberg 22-1-4 and Roenicke 7-0-1. Very few managers are more than a decision or two higher on the negative side. Girardi is 4-0-9, easily the worst, although his total score isn’t that negative, so most of his mistakes didn’t hurt too badly until they were compounded. His 4-0-9 strategic record yields a much worse score.
Even Terry Collins, at -115, is 11-2-11. Ron Washington, also among the worst, is 8-2-7, and McClendon 8-0-6.
This points to my bigger concern with the IBB: it might work, or appear to, especially after the first batter. But mistakes can be far more costly. On average, Collins’ decisions work through the next batter half the time, yet have been far more negative in sum. More on this in a moment.
Strategically, managers went 293-18-159, even better than tactically. Also, while their total tactical score was -28, the strategic one was +28. And, again, other than Girardi, the typical manager has a positive or barely negative percentage on their choice. Again, Scioscia (13-2-2), Sandberg (21-0-6) and Roenicke (7-0-1) have done the best. Hurdle improves from 14-1-7 to 17-1-4.
In other words, managers usually seem to get it right, nearly two out of every three times, but the sum result is essentially neutral. That one mistake costs as much as the two correct decisions. Collins, after all, is 12-2-10 in strategic decisions, but overwhelmingly his bad choices have had bigger consequences.
If a manager is to use the IBB, they need to recognize they are playing with fire. Some managers have, obviously, done well in picking their battles, including one of the newest. Others, like the New York skippers, haven’t.
And, to my utter surprise, managers appear to really be looking further down the line than the next batter. I never expected that, perhaps because I live in New York.
Cause of Losing or Losing Cause?
If the IBB is playing with fire, it makes sense then that the overwhelming majority of such instances are used in losses. Even when the manager successfully navigates the inning, it comes in a losing cause.
Why take a chance unless things already look grim? The results above are through June 28. Counting the 10 IBBs on June 29, when I decided to look into the win-loss dichotomy, only 50 IBBs were given by teams that were winning, 181 tied and 249 losing. In the end, the teams went 125-355, meaning that if you expected to split the difference on the ties, teams that intentionally walk fall behind the curve.
As much as I despise the IBB, I don’t think that’s fair. If the score is tied and there’s already a runner on second or third, the opposing team has a higher chance of winning. So unless it is issued to a batter with no one on or a runner on first and two out, the manager actually is at least slightly behind his opposition.
I am curious if these numbers have changed through time, as well as if managers tend to improve or do worse with the IBB as they gain experience. Right now, I don’t have the time or energy to find out, but I’d like to. Stay tuned, as maybe I’ll get there, or find some help to do so.


