ArtsAutosBooksBusinessEducationEntertainmentFamilyFashionFoodGamesGenderHealthHolidaysHomeHubPagesPersonal FinancePetsPoliticsReligionSportsTechnologyTravel

What the Performance Management Chart tells you. Power Based Guidance.
Updated on January 19, 2013
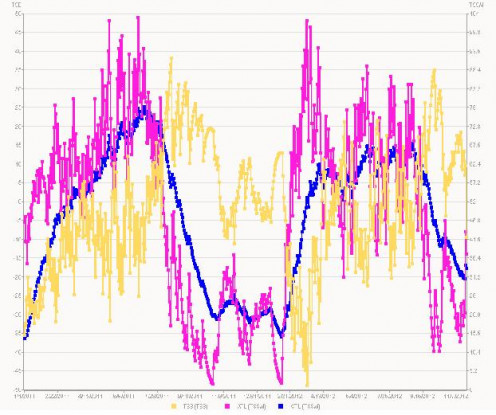
Yes, That's my Performance Management Chart. It's not exactly how I planned it to look after two years, but it's certainly helped me out a lot.

The Fundamentals

The Performance Management chart is one of the best tools developed for improving the direction and quality of your power based training. Once you have tested and found your Functional Threshold Power(FTP), you can begin to dive deep in to the world of using your numbers and quantifying not just every ride, ever pedal stroke, but actually see where your fitness and threshold stands in relative terms to previous days, weeks, months and years.

The Performance Management chart, of PMC for short, represents the accumulation of training, and the relative fatigue you should be experiencing from your training. The chart will reflect the growth in relation to the Training Stress Score(TSS) you acquire from you rides. TSS is relative to your FTP. Essentially Riding at 200 watts for 3 hours is harder for a person with a 250 FTP compared to a strong rider with a 350+ FTP.

TSS is determined by the relative intensity of the ride. This Intensity is represented by a value known as Intensity Factor(IF), which simply the Normalized Power(NP) divided by the riders FTP. To quantify the TSS of a ride we then take the IF value and multiply it by itself. For example:

250NP /300 ftp = .71IF

.71*.71 = .50

This number represents 1/100th of the TSS earned by riding for 1 hour at that intensity. Thus if the rider with an FTP of 300 rode an entire hour with a NP of 250 he would earn 50 TSS for that hour. It is excruciatingly difficult for a person to achieve 100 TSS in one hour.

Normalized Power is every second of power data rounded to the 30 second average, and multiplied to the 4th power then finding the 4th route. For simplification, NP will usually always be higher than average power. The higher the NP the more TSS you will gain for each ride.

1.1
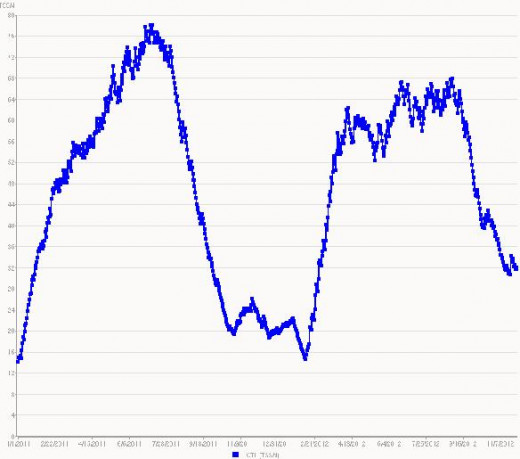
CTL Rises with each days workout, the rise depends on the amount of Stress Score each ride accumulates.

Chronic Training Load

Chronic Training Load is the representation of the cumulative value of your training stress score. CTL's value is not only dependent on your FTP and TSS, but your body's actual adaptation response. This adaptation response is referred to as your Constant(CTL_C). Typically speaking, the average person will have a Constant of approximately 42.5.

CTL is calculated by taking your TSS score and then subtracting your current CTL value dividing it by the Constant . For example, if your TSS for a ride is 120, and your CTL is 0, you will gain 2.82 CTL. Repeat this process for each subsequent day and you will begin to see a line as pictured ins image 1.1.

2.1
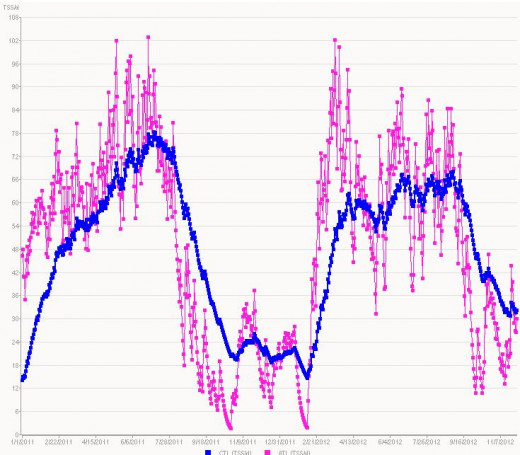
ATL Rises at a faster rate than CTL, we can call ATL(Magenta) the actual stress the body is under. Notice how ATL Spikes over and under the Blue CTL line

Acute Training Load

Acute Training Load is the representation of the cumulative value of your training stress score, much like CTL, ATL is the stress the body is currently under. ATL is not fitness but rather consider it Damage, the higher ATL get the more the body will be wanting to adapt, to the converse, to much ATL and you won't be able to perform well on each ride. ATL has it's own independent Constant value as well (ATL_C), this is typically the length of 1 week or 7 days, plus .5.

ATL is calculated by taking your TSS score and then subtracting your current ATL value dividing it by the Constant . For example, if your TSS for a ride is 120, and your ATL is 0, you will gain 16 ATL. Repeat this process for each subsequent day and you will begin to see a line as pictured ins image 2.1.

3.1
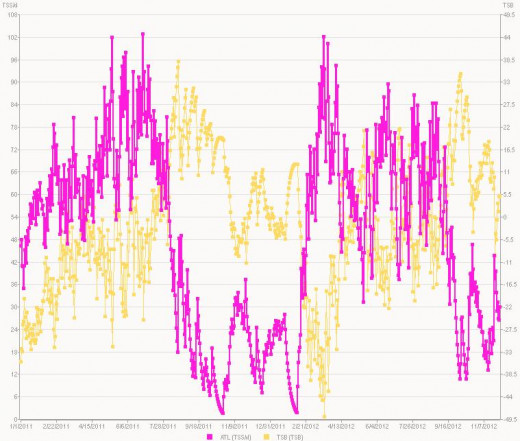
TSB Reflects the difference between ATL and CTL. It's movement will be in the opposite direction of ATL.

Training Stress Balance

Training Stress Balance(TSB) is a reflective value of the difference between your ATL and CTL. TSB is the only value on the Performance Management Chart that can be negative in value. As your CTL rises, so does your ATL:however, ATL rises at almost 6 times the rate that CTL will. Inevitably, ATL will become a much larger number than it's CTL counterpart. Likewise, ATL will also decrease at a much faster rate as well. This is a good thing, as this is a representation of your body recovering and adapting to it's new found fitness.

Your TSB is always CTL subtracted by ATL to give you your current TSB value. For example, if your TSS for a ride is 120, your currently CTL and ATL are 0, the following day you would have an CTL of 2.8 and an ATL of 16. This would give you a TSB of -13.2

TSB is the value used mostly to determine the TSS to attain on the following day's training. Typically a rider should plan to rest or take it "easy" should TSB be more than -20. This is to avoid pushing your body into to weak of a spot as to inhibit it's immune system. It is possible to dig deeper in to the TSB grave for added adaptation, and typically early on while establishing a solid CTL number it will be easy to reach numbers greater than -20 on your TSB. Riders that race in grand tours like The Tour de France, Giro di Italia and the Vuelta a Espana will often be well in the negative values of TSB, some exceeding -100. This kind of a debt though will require ample recovery time.

What do you use to track your training?

See results
working

This website uses cookies

As a user in the EEA, your approval is needed on a few things. To provide a better website experience, hubpages.com uses cookies (and other similar technologies) and may collect, process, and share personal data. Please choose which areas of our service you consent to our doing so.

For more information on managing or withdrawing consents and how we handle data, visit our Privacy Policy at: https://corp.maven.io/privacy-policy

Show Details
Necessary
HubPages Device IDThis is used to identify particular browsers or devices when the access the service, and is used for security reasons.
LoginThis is necessary to sign in to the HubPages Service.
Google RecaptchaThis is used to prevent bots and spam. (Privacy Policy)
AkismetThis is used to detect comment spam. (Privacy Policy)
HubPages Google AnalyticsThis is used to provide data on traffic to our website, all personally identifyable data is anonymized. (Privacy Policy)
HubPages Traffic PixelThis is used to collect data on traffic to articles and other pages on our site. Unless you are signed in to a HubPages account, all personally identifiable information is anonymized.
Amazon Web ServicesThis is a cloud services platform that we used to host our service. (Privacy Policy)
CloudflareThis is a cloud CDN service that we use to efficiently deliver files required for our service to operate such as javascript, cascading style sheets, images, and videos. (Privacy Policy)
Google Hosted LibrariesJavascript software libraries such as jQuery are loaded at endpoints on the googleapis.com or gstatic.com domains, for performance and efficiency reasons. (Privacy Policy)
Features
Google Custom SearchThis is feature allows you to search the site. (Privacy Policy)
Google MapsSome articles have Google Maps embedded in them. (Privacy Policy)
Google ChartsThis is used to display charts and graphs on articles and the author center. (Privacy Policy)
Google AdSense Host APIThis service allows you to sign up for or associate a Google AdSense account with HubPages, so that you can earn money from ads on your articles. No data is shared unless you engage with this feature. (Privacy Policy)
Google YouTubeSome articles have YouTube videos embedded in them. (Privacy Policy)
VimeoSome articles have Vimeo videos embedded in them. (Privacy Policy)
PaypalThis is used for a registered author who enrolls in the HubPages Earnings program and requests to be paid via PayPal. No data is shared with Paypal unless you engage with this feature. (Privacy Policy)
Facebook LoginYou can use this to streamline signing up for, or signing in to your Hubpages account. No data is shared with Facebook unless you engage with this feature. (Privacy Policy)
MavenThis supports the Maven widget and search functionality. (Privacy Policy)
Marketing
Google AdSenseThis is an ad network. (Privacy Policy)
Google DoubleClickGoogle provides ad serving technology and runs an ad network. (Privacy Policy)
Index ExchangeThis is an ad network. (Privacy Policy)
SovrnThis is an ad network. (Privacy Policy)
Facebook AdsThis is an ad network. (Privacy Policy)
Amazon Unified Ad MarketplaceThis is an ad network. (Privacy Policy)
AppNexusThis is an ad network. (Privacy Policy)
OpenxThis is an ad network. (Privacy Policy)
Rubicon ProjectThis is an ad network. (Privacy Policy)
TripleLiftThis is an ad network. (Privacy Policy)
Say MediaWe partner with Say Media to deliver ad campaigns on our sites. (Privacy Policy)
Remarketing PixelsWe may use remarketing pixels from advertising networks such as Google AdWords, Bing Ads, and Facebook in order to advertise the HubPages Service to people that have visited our sites.
Conversion Tracking PixelsWe may use conversion tracking pixels from advertising networks such as Google AdWords, Bing Ads, and Facebook in order to identify when an advertisement has successfully resulted in the desired action, such as signing up for the HubPages Service or publishing an article on the HubPages Service.
Statistics
Author Google AnalyticsThis is used to provide traffic data and reports to the authors of articles on the HubPages Service. (Privacy Policy)
ComscoreComScore is a media measurement and analytics company providing marketing data and analytics to enterprises, media and advertising agencies, and publishers. Non-consent will result in ComScore only processing obfuscated personal data. (Privacy Policy)
Amazon Tracking PixelSome articles display amazon products as part of the Amazon Affiliate program, this pixel provides traffic statistics for those products (Privacy Policy)
ClickscoThis is a data management platform studying reader behavior (Privacy Policy)