- HubPages»
- Sports and Recreation»
- Team Sports»
- American Football»
- NFL Football
U.S. States that Produce the Most Quality Football Players: Per Capita and Overall Production Ranks

The following database is a compilation of data, significant statistical accomplishments and awards, for the purpose of determining which U.S. states have the most impact on the game of American football.
Each player to accomplish a designated feat is attributed to the credit of his state of birth. The numbers are compiled in order to rank each state for production in two categories: Per capita production and Overall number of performances produced.
The Per Capita rank is designated with a per capita score: the division of the number of performances by said state’s current estimated population. Then the zeros before the number are eliminated to give the viewer a more visually palatable number. The overall number of performances rank is simply an addition of all performances equal to or above the designated mark.
This database is an ongoing work. The rankings will be updated at the end of each football season, and many more categories are to be added as time permits. Categories factored in thus far are National College Football awards on the FBS level, NFL Hall of Fame Members, 10 or more sacks in an NFL season, 7 or more interceptions in an NFL season, 3,000 or more yards passing in an NFL season, 1,000 or more yards rushing in an NFL season, and 1,000 or more receiving yards in an NFL season.
Thus far trends show the states of Louisiana and Mississippi to be the clear leaders in per capita production of quality football performances, while our two most populous states, California and Texas, are our leaders in the number of players produced.
An overview of the rankings in both categories is provided in the table below and the remainder of this database provides breakdowns of how each state scored in the 7 assessments done thus far.
For those of you interested in the players who have accomplished these feats, in the text box to your upper right are links to databases for each category. Each category database includes a list of all players from the individual states to accomplish the designated feat along with a detailed statistical analysis of his season where applicable.
Overview of State Ranks: Per Capita and Overall Production
State Rank
| Per Capita Score
| State Rank
| No. Performances
|
|---|---|---|---|
1. Louisiana
| 4,843
| 1. California
| 496
|
2. Mississippi
| 4,448
| 2. Texas
| 492
|
3. Oklahoma
| 2,676
| 3. Florida
| 329
|
4. Pennsylvania
| 2,514
| 4. Pennsylvania
| 321
|
5. Alabama
| 2,442
| 5. Ohio
| 268
|
6. Ohio
| 2,316
| 6. Louisiana
| 224
|
7. Arkansas
| 2,298
| 7. Georgia
| 208
|
8. Kansas
| 2,211
| 8. Virginia
| 134
|
9. Georgia
| 2,080
| 9. Mississippi
| 133
|
10. South Carolina
| 1,864
| 10. Alabama
| 128
|
11. Texas
| 1,861
| 11. New York
| 113
|
12. Nebraska
| 1,713
| 12. New Jersey
| 112
|
13. Florida
| 1,682
| 13. Illinois
| 106
|
14. Virginia
| 1,622
| 14. Michigan
| 104
|
15. West Virginia
| 1,457
| 15. Oklahoma
| 103
|
16. Iowa
| 1,391
| 16. North Carolina
| 93
|
17. California
| 1,294
| 17. South Carolina
| 89
|
18. New Jersey
| 1,258
| 18. Arkansas
| 68
|
19. New Mexico
| 1,151
| 19. Kansas
| 64
|
20. Michigan
| 1,050
| t20. Indiana
| 63
|
21. Minnesota
| 978
| t20. Washington
| 63
|
22. Indiana
| 959
| 22. Tennessee
| 58
|
23. South Dakota
| 947
| 23. Missouri
| 55
|
24. North Carolina
| 944
| 24. Minnesota
| 53
|
25. Missouri
| 911
| t25. Iowa
| 43
|
26. Washington
| 904
| t25. Maryland
| 43
|
27. Tennessee
| 894
| 27. Wisconsin
| 41
|
28. Illinois
| 822
| 28. Nebraska
| 32
|
29. Hawai'i
| 783
| t29. Kentucky
| 28
|
30. Maryland
| 725
| t29. Massachusetts
| 28
|
31. Utah
| 723
| 31. West Virginia
| 27
|
32. Wisconsin
| 713
| 32. New Mexico
| 24
|
33. North Dakota
| 691
| t33. Oregon
| 21
|
34. Kentucky
| 637
| t33. Utah
| 21
|
35. New York
| 575
| 35. Connecticut
| 20
|
36. Connecticut
| 556
| 36. Arizona
| 16
|
37. Oregon
| 534
| 37. Colorado
| 13
|
38. Idaho
| 434
| 38. Hawai'i
| 11
|
39. Massachusetts
| 420
| 39. Nevada
| 10
|
40. Nevada
| 377
| 40. South Dakota
| 8
|
41. Alaska
| 272
| 41. Idaho
| 7
|
42. Colorado
| 247
| 42. North Dakota
| 5
|
43. Arizona
| 242
| t43. Alaska
| 2
|
44. Montana
| 198
| t43. Montana
| 2
|
#1 California:
Overall Production
#1 Louisiana:
Per Capita Production
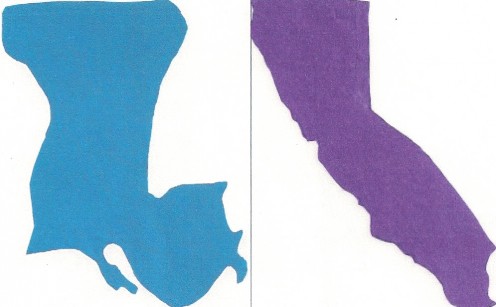
California is awesome!
Louisiana is awesome!
Louisiana
| California
| ||||
|---|---|---|---|---|---|
Category
| Rank
| Per Capita
| Category
| Rank
| No. Perf
|
HOFers
| 5
| 173
| HOFers
| 4
| 17
|
1,000 Rusher
| 1
| 973
| 1,000 Rusher
| 4
| 49
|
1,000 Receive
| 1
| 1,016
| 1,000 Receive
| 3
| 71
|
3,000 Passer
| 2
| 951
| 3,000 Passer
| 1
| 99
|
10 Sack
| 6
| 346
| 10 Sack
| 3
| 49
|
7 Int
| 1
| 735
| 7 Int
| 2
| 60
|
NCAA Awards
| 8
| 649
| NCAA Awards
| 1
| 151
|
Total
| 1
| 4,843
| Total
| 1
| 496
|
#2 Texas
Overall Production
#2 Mississippi
Per Capita Production
Mississippi
| Texas
| ||||
|---|---|---|---|---|---|
Category
| Rank
| Per Capita
| Category
| Rank
| No. Perf
|
HOFers
| 1
| 234
| HOFers
| 1
| 29
|
1,000 Rusher
| 2
| 970
| 1,000 Rusher
| 1
| 74
|
1,000 Receive
| 2
| 836
| 1,000 Receive
| 2
| 81
|
3,000 Passer
| 1
| 970
| 3,000 Passer
| t5
| 29
|
10 Sack
| 5
| 368
| 10 Sack
| 1
| 66
|
7 Int
| 2
| 535
| 7 Int
| 1
| 86
|
NCAA Awards
| 12
| 535
| NCAA Awards
| 2
| 127
|
Total
| 2
| 4,448
| Total
| 2
| 492
|
#3 Florida
Overall Production
#3 Oklahoma
Per Capita Production
Oklahoma
| Florida
| ||||
|---|---|---|---|---|---|
Category
| Rank
| Per Capita
| Category
| Rank
| No. Perf
|
HOFers
| 8
| 130
| HOFers
| 6
| 11
|
1,000 Rusher
| 20
| 130
| 1,000 Rusher
| 2
| 68
|
1,000 Receive
| 7
| 416
| 1,000 Receive
| 1
| 86
|
3,000 Passer
| 24
| 78
| 3,000 Passer
| t11
| 13
|
10 Sack
| 7
| 338
| 10 Sack
| 2
| 51
|
7 Int
| 8
| 260
| 7 Int
| 5
| 28
|
NCAA Awards
| 1
| 1,324
| NCAA Awards
| 5
| 72
|
Total
| 3
| 2,676
| Total
| 3
| 329
|
#4 Pennsylvania
Overall Production
#4 Pennsylvania
Per Capita Production

Pennsylvania
| Pennsylvania
| ||||
|---|---|---|---|---|---|
Category
| Rank
| Per Capita
| Category
| Rank
| No. Perf
|
HOFers
| 3
| 204
| HOFers
| 2
| 26
|
1,000 Rusher
| 4
| 415
| 1,000 Rusher
| 3
| 53
|
1,000 Receive
| 12
| 290
| 1,000 Receive
| 7
| 37
|
3,000 Passer
| 4
| 525
| 3,000 Passer
| 2
| 67
|
10 Sack
| 15
| 196
| 10 Sack
| t7
| 25
|
7 Int
| 7
| 313
| 7 Int
| 3
| 40
|
NCAA Awards
| 11
| 571
| NCAA Awards
| 4
| 73
|
Total
| 4
| 2,514
| Total
| 4
| 321
|
#5 Ohio
Overall Production
#5 Alabama
Per Capita Production
Alabama
| Ohio
| ||||
|---|---|---|---|---|---|
Category
| Rank
| Per Capita
| Category
| Rank
| No. Perf
|
HOFers
| 9
| 124
| HOFers
| 3
| 21
|
1,000 Rusher
| 16
| 166
| 1,000 Rusher
| 13
| 14
|
1,000 Receive
| 9
| 413.8
| 1,000 Receive
| 5
| 42
|
3,000 Passer
| 7
| 290
| 3,000 Passer
| t8
| 18
|
10 Sack
| 8
| 331
| 10 Sack
| 9
| 23
|
7 Int
| 5
| 331
| 7 Int
| 6
| 27
|
NCAA Awards
| 5
| 786
| NCAA Awards
| 3
| 123
|
Total
| 5
| 2,442
| Total
| 5
| 268
|
#6 Louisiana
Overall Production
#6 Ohio
Per Capita Production
Ohio
| Louisiana
| ||||
|---|---|---|---|---|---|
Category
| Rank
| Per Capita
| Category
| Rank
| No. Perf
|
HOFers
| 4
| 181
| HOFers
| 9
| 8
|
1,000 Rusher
| 22
| 121
| 1,000 Rusher
| 5
| 45
|
1,000 Receive
| 10
| 363
| 1,000 Receive
| 4
| 47
|
3,000 Passer
| 12
| 156
| 3,000 Passer
| 3
| 44
|
10 Sack
| 14
| 199
| 10 Sack
| t14
| 16
|
7 Int
| 9
| 233
| 7 Int
| 4
| 34
|
NCAA Awards
| 2
| 1,063
| NCAA Awards
| t10
| 30
|
Total
| 6
| 2,316
| Total
| 6
| 224
|
#7 Georgia
Overall Production
#7 Arkansas
Per Capita Production
Arkansas
| Georgia
| ||||
|---|---|---|---|---|---|
Category
| Rank
| Per Capita
| Category
| Rank
| No. Perf
|
HOFers
| 6
| 169
| HOFers
| t7
| 9
|
1,000 Rusher
| 7
| 338
| 1,000 Rusher
| 6
| 41
|
1,000 Receive
| 3
| 541
| 1,000 Receive
| t8
| 28
|
3,000 Passer
| N/A
| 0
| 3,000 Passer
| 17
| 9
|
10 Sack
| 2
| 642
| 10 Sack
| 4
| 46
|
7 Int
| 12
| 203
| 7 Int
| 11
| 15
|
NCAA Awards
| 16
| 405
| NCAA Awards
| 6
| 60
|
Total
| 7
| 2,298
| Total
| 7
| 208
|
#8 Virginia
Overall Production
#8 Kansas
Per Capita Production

Kansas
| Virginia
| ||||
|---|---|---|---|---|---|
Category
| Rank
| Per Capita
| Category
| Rank
| No. Perf
|
HOFers
| 7
| 138
| HOFers
| t7
| 9
|
1,000 Rusher
| 3
| 587
| 1,000 Rusher
| 8
| 22
|
1,000 Receive
| 28
| 69
| 1,000 Receive
| t13
| 20
|
3,000 Passer
| 6
| 449
| 3,000 Passer
| t13
| 12
|
10 Sack
| 28
| 104
| 10 Sack
| 5
| 37
|
7 Int
| 3
| 449
| 7 Int
| 7
| 19
|
NCAA Awards
| 15
| 414.6
| NCAA Awards
| t19
| 15
|
Total
| 8
| 2,211
| Total
| 8
| 134
|
#9 Mississippi
Overall Production
#9 Georgia
Per Capita Production
Georgia
| Mississippi
| ||||
|---|---|---|---|---|---|
Category
| Rank
| Per Capita
| Category
| Rank
| No. Perf
|
HOFers
| 19
| 90
| HOFers
| t10
| 7
|
1,000 Rusher
| 5
| 410
| 1,000 Rusher
| 7
| 29
|
1,000 Receive
| 14
| 280
| 1,000 Receive
| 10
| 25
|
3,000 Passer
| 23
| 90
| 3,000 Passer
| t5
| 29
|
10 Sack
| 3
| 460
| 10 Sack
| 20
| 11
|
7 Int
| 16
| 150
| 7 Int
| t8
| 16
|
NCAA Awards
| 10
| 600
| NCAA Awards
| 18
| 16
|
Total
| 9
| 2,080
| Total
| 9
| 133
|
#10 Alabama
Overall Production
#10 South Carolina
Per Capita Production
South Carolina
| Alabama
| ||||
|---|---|---|---|---|---|
Category
| Rank
| Per Capita
| Category
| Rank
| No. Perf
|
HOFers
| 33
| 42
| HOFers
| t13
| 6
|
1,000 Rusher
| 15
| 168
| 1,000 Rusher
| t19
| 8
|
1,000 Receive
| 6
| 439.81
| 1,000 Receive
| t13
| 30
|
3,000 Passer
| N/A
| 0
| 3,000 Passer
| 10
| 14
|
10 Sack
| 1
| 670
| 10 Sack
| t14
| 16
|
7 Int
| 4
| 335
| 7 Int
| t8
| 16
|
NCAA Awards
| 27
| 209.4
| NCAA Awards
| 8
| 38
|
Total
| 10
| 1,864
| Total
| 10
| 128
|
#11 New York
Overall Production
#11 Texas
Per Capita Production
Texas
| New York
| ||||
|---|---|---|---|---|---|
Category
| Rank
| Per Capita
| Category
| Rank
| No. Perf
|
HOFers
| 12
| 110
| HOFers
| t13
| 6
|
1,000 Rusher
| 10
| 280
| 1,000 Rusher
| 15
| 12
|
1,000 Receive
| 11
| 306
| 1,000 Receive
| t18
| 11
|
3,000 Passer
| 20
| 110
| 3,000 Passer
| 7
| 23
|
10 Sack
| 11
| 250
| 10 Sack
| t7
| 25
|
7 Int
| 6
| 325
| 7 Int
| t12
| 13
|
NCAA Awards
| 13
| 480
| NCAA Awards
| 13
| 23
|
Total
| 11
| 1,861
| Total
| 11
| 113
|
#12 New Jersey
Overall Production
#12 Nebraska
Per Capita Production
Nebraska
| New Jersey
| ||||
|---|---|---|---|---|---|
Category
| Rank
| Per Capita
| Category
| Rank
| No. Perf
|
HOFers
| 14
| 107
| HOFers
| t13
| 6
|
1,000 Rusher
| 9
| 321
| 1,000 Rusher
| 10
| 16
|
1,000 Receive
| N/A
| 0
| 1,000 Receive
| 11
| 22
|
3,000 Passer
| N/A
| 0
| 3,000 Passer
| t13
| 12
|
10 Sack
| 27
| 107
| 10 Sack
| t11
| 19
|
7 Int
| 14
| 161
| 7 Int
| 15
| 11
|
NCAA Awards
| 3
| 1,017
| NCAA Awards
| 12
| 26
|
Total
| 12
| 1,713
| Total
| 12
| 112
|
#13 Illinois
Overall Production
#13 Florida
Per Capita Production
Florida
| Illinois
| ||||
|---|---|---|---|---|---|
Category
| Rank
| Per Capita
| Category
| Rank
| No. Perf
|
HOFers
| 29
| 56
| HOFers
| 5
| 13
|
1,000 Rusher
| 6
| 348
| 1,000 Rusher
| t11
| 15
|
1,000 Receive
| 5
| 439.83
| 1,000 Receive
| t18
| 11
|
3,000 Passer
| 25
| 66
| 3,000 Passer
| t13
| 12
|
10 Sack
| 10
| 261
| 10 Sack
| 16
| 15
|
7 Int
| 17
| 143
| 7 Int
| t16
| 10
|
NCAA Awards
| 19
| 368
| NCAA Awards
| t10
| 30
|
Total
| 13
| 1,682
| Total
| 13
| 106
|
#14 Michigan
Overall Production
#14 Virginia
Per Capita Production

Virginia
| Michigan
| ||||
|---|---|---|---|---|---|
Category
| Rank
| Per Capita
| Category
| Rank
| No. Perf
|
HOFers
| 13
| 109
| HOFers
| t24
| 3
|
1,000 Rusher
| 11
| 266
| 1,000 Rusher
| t11
| 15
|
1,000 Receive
| 16
| 242
| 1,000 Receive
| 6
| 41
|
3,000 Passer
| 15
| 145
| 3,000 Passer
| t27
| 3
|
10 Sack
| 4
| 448
| 10 Sack
| t18
| 12
|
7 Int
| 10
| 230
| 7 Int
| t12
| 13
|
NCAA Awards
| 30
| 182
| NCAA Awards
| 17
| 17
|
Total
| 14
| 1,622
| Total
| 14
| 104
|
#15 Oklahoma
Overall Production
#15 West Virginia
Per Capita Production

West Virginia
| Oklahoma
| ||||
|---|---|---|---|---|---|
Category
| Rank
| Per Capita
| Category
| Rank
| No. Perf
|
HOFers
| 2
| 216
| HOFers
| t17
| 5
|
1,000 Rusher
| 12
| 216
| 1,000 Rusher
| t24
| 5
|
1,000 Receive
| 4
| 539
| 1,000 Receive
| t15
| 16
|
3,000 Passer
| N/A
| 0
| 3,000 Passer
| t27
| 3
|
10 Sack
| 19
| 162
| 10 Sack
| 17
| 13
|
7 Int
| 11
| 216
| 7 Int
| t16
| 10
|
NCAA Awards
| 36
| 108
| NCAA Awards
| 7
| 51
|
Total
| 15
| 1,457
| Total
| 15
| 103
|
#16 North Carolina
Overall Production
#16 Iowa
Per Capita Production
Iowa
| North Carolina
| ||||
|---|---|---|---|---|---|
Category
| Rank
| Per Capita
| Category
| Rank
| No. Perf
|
HOFers
| N/A
| 0
| HOFers
| t10
| 7
|
1,000 Rusher
| 26
| 97
| 1,000 Rusher
| 14
| 13
|
1,000 Receive
| 29
| 65
| 1,000 Receive
| t8
| 28
|
3,000 Passer
| 3
| 582
| 3,000 Passer
| t23
| 6
|
10 Sack
| 17
| 194
| 10 Sack
| 10
| 21
|
7 Int
| 30
| 65
| 7 Int
| t19
| 6
|
NCAA Awards
| 18
| 388
| NCAA Awards
| t23
| 12
|
Total
| 16
| 1,391
| Total
| 16
| 93
|
#17 South Carolina
Overall Production
#17 California
Per Capita Production
California
| South Carolina
| ||||
|---|---|---|---|---|---|
Category
| Rank
| Per Capita
| Category
| Rank
| No. Perf
|
HOFers
| 31
| 44
| HOFers
| t29
| 2
|
1,000 Rusher
| 21
| 128
| 1,000 Rusher
| t19
| 8
|
1,000 Receive
| 18
| 185
| 1,000 Receive
| 12
| 21
|
3,000 Passer
| 9
| 258
| 3,000 Passer
| N/A
| 0
|
10 Sack
| 23
| 128
| 10 Sack
| 6
| 32
|
7 Int
| 15
| 157
| 7 Int
| t8
| 16
|
NCAA Awards
| 17
| 394
| NCAA Awards
| 31
| 10
|
Total
| 17
| 1,294
| Total
| 17
| 89
|
#18 Arkansas
Overall Production
#18 New Jersey
Per Capita Production
New Jersey
| Arkansas
| ||||
|---|---|---|---|---|---|
Category
| Rank
| Per Capita
| Category
| Rank
| No. Perf
|
HOFers
| 26
| 67
| HOFers
| t17
| 5
|
1,000 Rusher
| 13
| 180
| 1,000 Rusher
| t16
| 10
|
1,000 Receive
| 15
| 247
| 1,000 Receive
| t15
| 16
|
3,000 Passer
| 17
| 135
| 3,000 Passer
| N/A
| 0
|
10 Sack
| 12
| 213.5
| 10 Sack
| t11
| 19
|
7 Int
| 21
| 123.6
| 7 Int
| t19
| 6
|
NCAA Awards
| 21
| 292
| NCAA Awards
| t23
| 12
|
Total
| 18
| 1,258
| Total
| 18
| 68
|
#19 Kansas
Overall Production
#19 New Mexico
Per Capita Production
New Mexico
| Kansas
| ||||
|---|---|---|---|---|---|
Category
| Rank
| Per Capita
| Category
| Rank
| No. Perf
|
HOFers
| 18
| 96
| HOFers
| t20
| 4
|
1,000 Rusher
| N/A
| 0
| 1,000 Rusher
| 9
| 17
|
1,000 Receive
| 20
| 144
| 1,000 Receive
| t28
| 2
|
3,000 Passer
| N/A
| 0
| 3,000 Passer
| t11
| 13
|
10 Sack
| N/A
| 0
| 10 Sack
| t27
| 3
|
7 Int
| 13
| 192
| 7 Int
| t12
| 13
|
NCAA Awards
| 7
| 719
| NCAA Awards
| t23
| 12
|
Total
| 19
| 1,151
| Total
| 19
| 64
|
t#20 Indiana
Overall Production
#20 Michigan
Per Capita Production
Michigan
| Indiana
| ||||
|---|---|---|---|---|---|
Category
| Rank
| Per Capita
| Category
| Rank
| No. Perf
|
HOFers
| 35
| 30.3
| HOFers
| t24
| 3
|
1,000 Rusher
| 17
| 152
| 1,000 Rusher
| t30
| 2
|
1,000 Receive
| 8
| 414.3
| 1,000 Receive
| 24
| 5
|
3,000 Passer
| 30
| 30
| 3,000 Passer
| 16
| 10
|
10 Sack
| 25
| 121
| 10 Sack
| t18
| 12
|
7 Int
| 19
| 131
| 7 Int
| 18
| 9
|
NCAA Awards
| 32
| 171.8
| NCAA Awards
| 14
| 22
|
Total
| 20
| 1,050
| Total
| t20
| 63
|
t#20 Washington
Overall Production
#21 Minnesota
Per Capita Production
Minnesota
| Washington
| ||||
|---|---|---|---|---|---|
Category
| Rank
| Per Capita
| Category
| Rank
| No. Perf
|
HOFers
| 22
| 74
| HOFers
| t24
| 3
|
1,000 Rusher
| N/A
| 0
| 1,000 Rusher
| t19
| 8
|
1,000 Receive
| 19
| 166
| 1,000 Receive
| t28
| 2
|
3,000 Passer
| N/A
| 0
| 3,000 Passer
| 4
| 32
|
10 Sack
| 31
| 92
| 10 Sack
| t33
| 1
|
7 Int
| N/A
| 0
| 7 Int
| t23
| 5
|
NCAA Awards
| 9
| 646
| NCAA Awards
| t23
| 12
|
Total
| 21
| 978
| Total
| t20
| 63
|
#22 Tennessee
Overall Production
#22 Indiana
Per Capita Production
Indiana
| Tennessee
| ||||
|---|---|---|---|---|---|
Category
| Rank
| Per Capita
| Category
| Rank
| No. Perf
|
HOFers
| 30
| 46
| HOFers
| t17
| 5
|
1,000 Rusher
| 31
| 30
| 1,000 Rusher
| t26
| 4
|
1,000 Receive
| 27
| 76
| 1,000 Receive
| t25
| 4
|
3,000 Passer
| 14
| 152
| 3,000 Passer
| t25
| 4
|
10 Sack
| 18
| 183
| 10 Sack
| 13
| 17
|
7 Int
| 18
| 137
| 7 Int
| t19
| 6
|
NCAA Awards
| 20
| 335
| NCAA Awards
| 16
| 18
|
Total
| 22
| 959
| Total
| 22
| 58
|
#23 Missouri
Overall Production
#23 South Dakota
Per Capita Production
South Dakota
| Missouri
| ||||
|---|---|---|---|---|---|
Category
| Rank
| Per Capita
| Category
| Rank
| No. Perf
|
HOFers
| 11
| 118
| HOFers
| t13
| 6
|
1,000 Rusher
| N/A
| 0
| 1,000 Rusher
| t19
| 8
|
1,000 Receive
| N/A
| 0
| 1,000 Receive
| 17
| 12
|
3,000 Passer
| N/A
| 0
| 3,000 Passer
| t27
| 3
|
10 Sack
| N/A
| 0
| 10 Sack
| t23
| 6
|
7 Int
| N/A
| 0
| 7 Int
| t19
| 6
|
NCAA Awards
| 4
| 829
| NCAA Awards
| 21
| 14
|
Total
| 23
| 947
| Total
| 23
| 55
|
#24 Minnesota
Overall Production
#24 North Carolina
Per Capita Production
North Carolina
| Minnesota
| ||||
|---|---|---|---|---|---|
Category
| Rank
| Per Capita
| Category
| Rank
| No. Perf
|
HOFers
| 23
| 71
| HOFers
| t20
| 4
|
1,000 Rusher
| 19
| 132
| 1,000 Rusher
| N/A
| 0
|
1,000 Receive
| 13
| 284
| 1,000 Receive
| 21
| 9
|
3,000 Passer
| 27
| 61
| 3,000 Passer
| N/A
| 0
|
10 Sack
| 13
| 213.3
| 10 Sack
| 25
| 5
|
7 Int
| 31
| 61
| 7 Int
| N/A
| 0
|
NCAA Awards
| 34
| 122
| NCAA Awards
| 9
| 35
|
Total
| 24
| 944
| Total
| 24
| 53
|
t#25 Iowa
Overall Production
#25 Missouri
Per Capita Production
Missouri
| Iowa
| ||||
|---|---|---|---|---|---|
Category
| Rank
| Per Capita
| Category
| Rank
| No. Perf
|
HOFers
| 16
| 99.2
| HOFers
| N/A
| 0
|
1,000 Rusher
| 18
| 132.4
| 1,000 Rusher
| t28
| 3
|
1,000 Receive
| 17
| 199
| 1,000 Receive
| t28
| 2
|
3,000 Passer
| 28
| 50
| 3,000 Passer
| t8
| 18
|
10 Sack
| 30
| 99
| 10 Sack
| t23
| 6
|
7 Int
| 23
| 99
| 7 Int
| t31
| 2
|
NCAA Awards
| 25
| 232
| NCAA Awards
| t23
| 12
|
Total
| 25
| 911
| Total
| t25
| 43
|
t#25 Maryland
Overall Production
#26 Washington
Per Capita Production

Washington
| Maryland
| ||||
|---|---|---|---|---|---|
Category
| Rank
| Per Capita
| Category
| Rank
| No. Perf
|
HOFers
| 32
| 43
| HOFers
| N/A
| 0
|
1,000 Rusher
| 24
| 115
| 1,000 Rusher
| t16
| 10
|
1,000 Receive
| 36
| 29
| 1,000 Receive
| t22
| 6
|
3,000 Passer
| 5
| 459
| 3,000 Passer
| 30
| 2
|
10 Sack
| 37
| 14
| 10 Sack
| 21
| 8
|
7 Int
| 27
| 72
| 7 Int
| t25
| 4
|
NCAA Awards
| 31
| 172.1
| NCAA Awards
| 22
| 13
|
Total
| 26
| 904
| Total
| t25
| 43
|
#27 Wisconsin
Overall Production
#27 Tennessee
Per Capita Production
Tennessee
| Wisconsin
| ||||
|---|---|---|---|---|---|
Category
| Rank
| Per Capita
| Category
| Rank
| No. Perf
|
HOFers
| 21
| 77
| HOFers
| t10
| 7
|
1,000 Rusher
| 27
| 62
| 1,000 Rusher
| t30
| 2
|
1,000 Receive
| 30
| 62
| 1,000 Receive
| t22
| 6
|
3,000 Passer
| 26
| 62
| 3,000 Passer
| t18
| 8
|
10 Sack
| 9
| 262
| 10 Sack
| t27
| 3
|
7 Int
| 24
| 92
| 7 Int
| t29
| 3
|
NCAA Awards
| 23
| 277
| NCAA Awards
| t23
| 12
|
Total
| 27
| 894
| Total
| 27
| 41
|
#28 Nebraska
Overall Production
#28 Illinois
Per Capita Production
Illinois
| Nebraska
| ||||
|---|---|---|---|---|---|
Category
| Rank
| Per Capita
| Category
| Rank
| No. Perf
|
HOFers
| 15
| 101
| HOFers
| t29
| 2
|
1,000 Rusher
| 23
| 116
| 1,000 Rusher
| 23
| 6
|
1,000 Receive
| 26
| 85
| 1,000 Receive
| N/A
| 0
|
3,000 Passer
| 22
| 93
| 3,000 Passer
| N/A
| 0
|
10 Sack
| 26
| 116
| 10 Sack
| 32
| 2
|
7 Int
| 25
| 78
| 7 Int
| t29
| 3
|
NCAA Awards
| 24
| 233
| NCAA Awards
| 15
| 19
|
Total
| 28
| 822
| Total
| 28
| 32
|
t#29 Kentucky
Overall Production
#29 Hawai'i
Per Capita Production
Hawai'i
| Kentucky
| ||||
|---|---|---|---|---|---|
Category
| Rank
| Per Capita
| Category
| Rank
| No. Perf
|
HOFers
| N/A
| 0
| HOFers
| t24
| 3
|
1,000 Rusher
| N/A
| 0
| 1,000 Rusher
| t24
| 5
|
1,000 Receive
| N/A
| 0
| 1,000 Receive
| t34
| 1
|
3,000 Passer
| N/A
| 0
| 3,000 Passer
| t21
| 7
|
10 Sack
| N/A
| 0
| 10 Sack
| N/A
| 0
|
7 Int
| N/A
| 0
| 7 Int
| t23
| 5
|
NCAA Awards
| 6
| 783
| NCAA Awards
| t32
| 7
|
Total
| 29
| 783
| Total
| t29
| 28
|
t#29 Massachusetts
Overall Production
#30 Maryland
Per Capita Production

Maryland
| Massachusetts
| ||||
|---|---|---|---|---|---|
Category
| Rank
| Per Capita
| Category
| Rank
| No. Perf
|
HOFers
| N/A
| 0
| HOFers
| t20
| 4
|
1,000 Rusher
| 14
| 169
| 1,000 Rusher
| t28
| 3
|
1,000 Receive
| 25
| 101
| 1,000 Receive
| t28
| 2
|
3,000 Passer
| 29
| 34
| 3,000 Passer
| t18
| 8
|
10 Sack
| 22
| 135
| 10 Sack
| t27
| 3
|
7 Int
| 28
| 67
| 7 Int
| t34
| 1
|
NCAA Awards
| 26
| 219
| NCAA Awards
| t32
| 7
|
Total
| 30
| 725
| Total
| t29
| 28
|
#31 West Virginia
Overall Production
#31 Utah
Per Capita Production
Utah
| West Virginia
| ||||
|---|---|---|---|---|---|
Category
| Rank
| Per Capita
| Category
| Rank
| No. Perf
|
HOFers
| 24
| 69
| HOFers
| t20
| 4
|
1,000 Rusher
| N/A
| 0
| 1,000 Rusher
| t26
| 4
|
1,000 Receive
| 33
| 34
| 1,000 Receive
| 20
| 10
|
3,000 Passer
| 8
| 276
| 3,000 Passer
| N/A
| 0
|
10 Sack
| 29
| 103
| 10 Sack
| t27
| 3
|
7 Int
| 35
| 34
| 7 Int
| t25
| 4
|
NCAA Awards
| 29
| 207
| NCAA Awards
| t39
| 2
|
Total
| 31
| 723
| Total
| 31
| 27
|
#32 New Mexico
Overall Production
#32 Wisconsin
Per Capita Production
Wisconsin
| New Mexico
| ||||
|---|---|---|---|---|---|
Category
| Rank
| Per Capita
| Category
| Rank
| No. Perf
|
HOFers
| 10
| 122
| HOFers
| t29
| 2
|
1,000 Rusher
| 30
| 35
| 1,000 Rusher
| N/A
| 0
|
1,000 Receive
| 24
| 104
| 1,000 Receive
| 27
| 3
|
3,000 Passer
| 16
| 139
| 3,000 Passer
| N/A
| 0
|
10 Sack
| 33
| 52
| 10 Sack
| N/A
| 0
|
7 Int
| 34
| 52
| 7 Int
| t25
| 4
|
NCAA Awards
| 28
| 208.9
| NCAA Awards
| t19
| 15
|
Total
| 32
| 713
| Total
| 32
| 24
|
t#33 Oregon
Overall Production
#33 North Dakota
Per Capita Production
North Dakota
| Oregon
| ||||
|---|---|---|---|---|---|
Category
| Rank
| Per Capita
| Category
| Rank
| No. Perf
|
HOFers
| N/A
| 0
| HOFers
| t34
| 1
|
1,000 Rusher
| N/A
| 0
| 1,000 Rusher
| N/A
| 0
|
1,000 Receive
| 21
| 138
| 1,000 Receive
| t28
| 2
|
3,000 Passer
| N/A
| 0
| 3,000 Passer
| t23
| 6
|
10 Sack
| 20
| 138
| 10 Sack
| t33
| 1
|
7 Int
| N/A
| 0
| 7 Int
| N/A
| 0
|
NCAA Awards
| 14
| 414.7
| NCAA Awards
| t29
| 11
|
Total
| 33
| 691
| Total
| t33
| 21
|
t#33 Utah
Overall Production
#34 Kentucky
Per Capita Production
Kentucky
| Utah
| ||||
|---|---|---|---|---|---|
Category
| Rank
| Per Capita
| Category
| Rank
| No. Perf
|
HOFers
| 25
| 68
| HOFers
| t29
| 2
|
1,000 Rusher
| 25
| 114
| 1,000 Rusher
| N/A
| 0
|
1,000 Receive
| 37
| 23
| 1,000 Receive
| t34
| 1
|
3,000 Passer
| 11
| 159
| 3,000 Passer
| t18
| 8
|
10 Sack
| N/A
| 0
| 10 Sack
| t27
| 3
|
7 Int
| 22
| 114
| 7 Int
| t34
| 1
|
NCAA Awards
| 33
| 159
| NCAA Awards
| 35
| 6
|
Total
| 34
| 637
| Total
| t33
| 21
|
#35 Connecticut
Overall Production
#35 New York
Per Capita Production

New York
| Connecticut
| ||||
|---|---|---|---|---|---|
Category
| Rank
| Per Capita
| Category
| Rank
| No. Perf
|
HOFers
| 34
| 31
| HOFers
| t24
| 3
|
1,000 Rusher
| 28
| 61
| 1,000 Rusher
| t32
| 1
|
1,000 Receive
| 31
| 56
| 1,000 Receive
| t25
| 4
|
3,000 Passer
| 19
| 117
| 3,000 Passer
| N/A
| 0
|
10 Sack
| 24
| 127
| 10 Sack
| 22
| 7
|
7 Int
| 29
| 66
| 7 Int
| t31
| 2
|
NCAA Awards
| 35
| 117
| NCAA Awards
| t36
| 3
|
Total
| 35
| 575
| Total
| 35
| 20
|
#36 Arizona
Overall Production
#36 Connecticut
Per Capita Production
Connecticut
| Arizona
| ||||
|---|---|---|---|---|---|
Category
| Rank
| Per Capita
| Category
| Rank
| No. Perf
|
HOFers
| 20
| 83
| HOFers
| t29
| 2
|
1,000 Rusher
| 32
| 28
| 1,000 Rusher
| t32
| 1
|
1,000 Receive
| 23
| 111
| 1,000 Receive
| t28
| 2
|
3,000 Passer
| N/A
| 0
| 3,000 Passer
| t21
| 7
|
10 Sack
| 16
| 195
| 10 Sack
| t33
| 1
|
7 Int
| 32
| 56
| 7 Int
| t34
| 1
|
NCAA Awards
| 39
| 83
| NCAA Awards
| t39
| 2
|
Total
| 36
| 556
| Total
| 36
| 16
|
#37 Colorado
Overall Production
#37 Oregon
Per Capita Production
Oregon
| Colorado
| ||||
|---|---|---|---|---|---|
Category
| Rank
| Per Capita
| Category
| Rank
| No. Perf
|
HOFers
| 37
| 25
| HOFers
| t34
| 1
|
1,000 Rusher
| N/A
| 0
| 1,000 Rusher
| t32
| 1
|
1,000 Receive
| 32
| 51
| 1,000 Receive
| N/A
| 0
|
3,000 Passer
| 13
| 153
| 3,000 Passer
| N/A
| 0
|
10 Sack
| 35
| 25
| 10 Sack
| 26
| 4
|
7 Int
| N/A
| 0
| 7 Int
| t25
| 4
|
NCAA Awards
| 22
| 280
| NCAA Awards
| t36
| 3
|
Total
| 37
| 534
| Total
| 37
| 13
|
#38 Hawai'i
Overall Production
#38 Idaho
Per Capita Production
Idaho
| Hawai'i
| ||||
|---|---|---|---|---|---|
Category
| Rank
| Per Capita
| Category
| Rank
| No. Perf
|
HOFers
| 27
| 62
| HOFers
| N/A
| 0
|
1,000 Rusher
| N/A
| 0
| 1,000 Rusher
| N/A
| 0
|
1,000 Receive
| N/A
| 0
| 1,000 Receive
| N/A
| 0
|
3,000 Passer
| 10
| 248
| 3,000 Passer
| N/A
| 0
|
10 Sack
| N/A
| 0
| 10 Sack
| N/A
| 0
|
7 Int
| 20
| 124.1
| 7 Int
| N/A
| 0
|
NCAA Awards
| N/A
| 0
| NCAA Awards
| t29
| 11
|
Total
| 38
| 434
| Total
| 38
| 11
|
#39 Nevada
Overall Production
#39 Massachusetts
Per Capita Production
Massachusetts
| Nevada
| ||||
|---|---|---|---|---|---|
Category
| Rank
| Per Capita
| Category
| Rank
| No. Perf
|
HOFers
| 28
| 60
| HOFers
| N/A
| 0
|
1,000 Rusher
| 29
| 45
| 1,000 Rusher
| 18
| 9
|
1,000 Receive
| 35
| 29.9
| 1,000 Receive
| N/A
| 0
|
3,000 Passer
| 18
| 120
| 3,000 Passer
| N/A
| 0
|
10 Sack
| 34
| 45
| 10 Sack
| N/A
| 0
|
7 Int
| 37
| 14.9
| 7 Int
| t34
| 1
|
NCAA Awards
| 37
| 105
| NCAA Awards
| N/A
| 0
|
Total
| 39
| 420
| Total
| 39
| 10
|
#40 South Dakota
Overall Production
#40 Nevada
Per Capita Production
Nevada
| South Dakota
| ||||
|---|---|---|---|---|---|
Category
| Rank
| Per Capita
| Category
| Rank
| No. Perf
|
HOFers
| N/A
| 0
| HOFers
| t34
| 1
|
1,000 Rusher
| 8
| 323
| 1,000 Rusher
| N/A
| 0
|
1,000 Receive
| N/A
| 0
| 1,000 Receive
| N/A
| 0
|
3,000 Passer
| N/A
| 0
| 3,000 Passer
| N/A
| 0
|
10 Sack
| N/A
| 0
| 10 Sack
| N/A
| 0
|
7 Int
| 33
| 54
| 7 Int
| N/A
| 0
|
NCAA Awards
| N/A
| 0
| NCAA Awards
| t32
| 7
|
Total
| 40
| 377
| Total
| 40
| 8
|
#41 Idaho
Overall Production
#41 Alaska
Per Capita Production
Alaska
| Idaho
| ||||
|---|---|---|---|---|---|
Category
| Rank
| Per Capita
| Category
| Rank
| No. Perf
|
HOFers
| N/A
| 0
| HOFers
| t34
| 1
|
1,000 Rusher
| N/A
| 0
| 1,000 Rusher
| N/A
| 0
|
1,000 Receive
| 22
| 136
| 1,000 Receive
| N/A
| 0
|
3,000 Passer
| N/A
| 0
| 3,000 Passer
| t25
| 4
|
10 Sack
| 21
| 136
| 10 Sack
| N/A
| 0
|
7 Int
| N/A
| 0
| 7 Int
| t31
| 2
|
NCAA Awards
| N/A
| 0
| NCAA Awards
| N/A
| 0
|
Total
| 41
| 272
| Total
| 41
| 7
|
#42 North Dakota
Overall Production
#42 Colorado
Per Capita Production
Colorado
| North Dakota
| ||||
|---|---|---|---|---|---|
Category
| Rank
| Per Capita
| Category
| Rank
| No. Perf
|
HOFers
| 38
| 19
| HOFers
| N/A
| 0
|
1,000 Rusher
| 33
| 19
| 1,000 Rusher
| N/A
| 0
|
1,000 Receive
| N/A
| 0
| 1,000 Receive
| t34
| 1
|
3,000 Passer
| N/A
| 0
| 3,000 Passer
| N/A
| 0
|
10 Sack
| 32
| 76
| 10 Sack
| t33
| 1
|
7 Int
| 26
| 76
| 7 Int
| N/A
| 0
|
NCAA Awards
| 40
| 57
| NCAA Awards
| t36
| 3
|
Total
| 42
| 247
| Total
| 42
| 5
|
t#43 Alaska
Overall Production
#43 Arizona
Per Capita Production
Arizona
| Alaska
| ||||
|---|---|---|---|---|---|
Category
| Rank
| Per Capita
| Category
| Rank
| No. Perf
|
HOFers
| 36
| 30.2
| HOFers
| N/A
| 0
|
1,000 Rusher
| 34
| 15
| 1,000 Rusher
| N/A
| 0
|
1,000 Receive
| 34
| 30.2
| 1,000 Receive
| t34
| 1
|
3,000 Passer
| 21
| 106
| 3,000 Passer
| N/A
| 0
|
10 Sack
| 36
| 15
| 10 Sack
| t33
| 1
|
7 Int
| 36
| 15.1
| 7 Int
| N/A
| 0
|
NCAA Awards
| 41
| 30
| NCAA Awards
| N/A
| 0
|
Total
| 43
| 242
| Total
| t43
| 2
|
t#43 Montana
Overall Production
#44 Montana
Per Capita Production
Montana
| Montana
| ||||
|---|---|---|---|---|---|
Category
| Rank
| Per Capita
| Category
| Rank
| No. Perf
|
HOFers
| 17
| 98.5
| HOFers
| t34
| 1
|
1,000 Rusher
| N/A
| 0
| 1,000 Rusher
| N/A
| 0
|
1,000 Receive
| N/A
| 0
| 1,000 Receive
| N/A
| 0
|
3,000 Passer
| N/A
| 0
| 3,000 Passer
| N/A
| 0
|
10 Sack
| N/A
| 0
| 10 Sack
| N/A
| 0
|
7 Int
| N/A
| 0
| 7 Int
| N/A
| 0
|
NCAA Awards
| 38
| 99
| NCAA Awards
| 41
| 1
|
Total
| 44
| 198
| Total
| t43
| 2
|
States Yet to Qualify for Our Rankings
The following U.S. states have yet to qualify in a single category: Delaware, Maine, New Hampshire, Rhode Island, Vermont, and Wyoming.
Related

US States With Most NFL Hall of Famers

States to Produce the Most Quality Pass Defenders, States 11-18: Installment 3
States to Produce the Most Quality Pass Defenders, Overview and States 1-5: Installment 1
States to Produce the Most NFL Players with 10 or More Sacks in a Season: Installment 1, Overview and States 1-5
AFL/NFL 3,000 Yard Passers State by State Rank and Overview: Installment 1