- HubPages»
- Technology»
- Computers & Software»
- Computer Science & Programming»
- Programming Languages
Add a user interface to drawing with Javascript - part 7 in a series
A user interface for graphing paths in 2 dimensions

Discussion of UI in Javascript
In this Hub, I am going to try to put a UI on my graphing calculator, and I am going to run into an instructive difficulty.
I'm afraid the example code has gotten rather lengthy. So, please, look at the earlier hubs in this series to understand the steps in how it got that way.
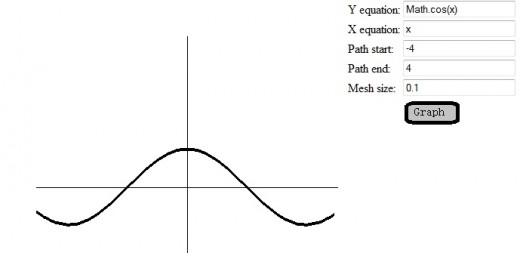
The first new part is easy. I added a form to my page to accept input from the user. I will need a equation for each of the x and y coordinates, and start, end and mesh size for the path. For graphs, the equation for x will just be, x.
I will bring out another powerful tool, eval, to evaluate the equation the user enters. This isn't too bad as long as the user knows enough javascript syntax to write an expression. So, I have to write sin(x) as "Math.sin(x)", for example. I could do some things to make this nicer, or put more effort into my UI to give the user some calculator buttons and generate the expressions within my code.
The difficulty comes when I want to use my integration and differentiation functions. There is no existing function for differentiating, or integrating, my expression. I need two things to happen. I need the differentiation function to be created, then I need for that function to be called with the evaluation of every point on the path. The code for doing that is a bit too complex to just write in an expression and pass to eval. It seems I will need to parse the expression and create the required functions, first. I guess that is a good topic for my next hub in this series.
Meanwhile lets look at the function, jggraph. It works well enough on expressions that only require built-in javascript fuctionality. It converts the formulas given by the user into javascript functions using eval, then combines them into a javascript function for computing the path function, scales the coordinate space, and finally calls drawcurve to render the graph.
I should mention there are some hazards to letting the user type in data that is going to be passed to eval. The user can enter any javascript code here, and can do whatever they want that javascript can do. If I put my calculator up on a public web site, it will therefore be open to reflected javascript injection attacks. In general, a user can alter, or destroy my program with this mechanism. In this context, I am not concerned about this, yet, because I am just explaining the concept, but I should give an advisory, in case you will want to use eval in other contexts. It is also another reason to parse the user input, but that is a step for the next hub.
code for iteractive graphing with javascript
<html>
<head>
<style type="text/css" >
.whiterectangle { color: white; background-color: white; z-index: 0;}
.blackrectangle { color: black; background-color: black; z-index: 1;}
.jgdialog { position: absolute; top:0; left:460; z-index:1; }
</style>
<script type="text/javascript" >

var jgpointbase = {
	x: 0,
	y: 0
};

var msize = 0.1;

function jgpoint( ) {
	this.prototype = jgpointbase;
	//this.x = x;
	//this.y = y;
};

function jgptsc( x, y ) {
		var rval = new jgpoint( );
		rval.x =  this.screenx0 + (( this.screenx1 - this.screenx0 ) / ( this.x1 - this.x0

)) * ( x - this.x0 );
		rval.y =  this.screeny0 + (( this.screeny1 - this.screeny0 ) / ( this.y1 - this.y0

)) * ( y - this.y0 );
		return( rval );
}

var jgcoordinatesbase = {
	x0: -1.25,
	screenx0: 50,
	y0: -1.25,
	screeny0: 450,
	x1: 1.25,
	screenx1: 450,
	y1: 1.25,
	screeny1: 50,
	pointToScreenCoordinates: jgptsc,
	scaleToCurve: function ( curvefn, fnstart, fnstop, delta ) {
		var pt;
		var fofpt;

		// get maximum and minimum x and y values
		fofpt = curvefn( fnstart );
		var minx = fnstart;
		var miny = fofpt.y;
		var maxx = fnstop;
		var maxy = fofpt.y;
		for( pt = fnstart + delta ; pt < fnstop; pt += delta ) {
			fofpt = curvefn( pt );
			if( fofpt.y > maxy ) {
				maxy = fofpt.y;
			}
			if( fofpt.y < miny ) {
				miny = fofpt.y;
			}
		}
		var aspectratio = ( this.y1 - this.y0 ) / ( this.x1 - this.x0 );
		if( this.y0 < miny ) {
			miny = this.y0;
		}
		if( this.y1 > maxy ) {
			maxy = this.y1;
		}
		if( this.x0 < minx ) {
			minx = this.x0;
		}
		if( this.x1 > maxx ) {
			maxx = this.x1;
		}
		var newaspectratio = ( maxy - miny ) / (maxx - minx );
		if( newaspectratio > aspectratio ) {
			// match y values and scale x values
			this.y0 = miny;
			this.y1 = maxy;
			var xlength = 1 / aspectratio * ( maxy - miny );
			this.x0 = minx + (maxx - minx) / 2 - xlength / 2;
			this.x1 = minx + (maxx - minx) / 2 + xlength / 2;
		} else {
			// match x values and scale y values
			this.x0 = minx;
			this.x1 = maxx;
			var ylength = aspectratio * ( maxx - minx );
			this.y0 = miny + (maxy - miny) / 2 - ylength / 2;
			this.y1 = miny + (maxy - miny) / 2 + ylength / 2;
		}
	}
};

function jgcoordinates() {
}

jgcoordinates.prototype = jgcoordinatesbase;


function drawrectangle( myclass, top, left, width, height )
{
	var bodylist = document.getElementsByTagName( "body" );
	var rect = document.createElement( "div" );
	var mystyle = 'position:absolute;top:' + top + ";left:" + left + ';width:' + width +

";height:" + height;
	rect.setAttribute( "class", myclass );
	rect.setAttribute( "style", mystyle );
	bodylist[0].appendChild( rect );
}

function drawline( width, x1, y1, x2, y2 )
{
	var x, y, nexty, nextx;
	x1 = Math.round( x1 );
	y1 = Math.round( y1 );
	x2 = Math.round( x2 );
	y2 = Math.round( y2 );
	// ensure x1, y1 is leftmost point
	if( x1 > x2 ) {
		tmp = x2;
		x2 = x1;
		x1 = tmp;
		tmp = y2;
		y2 = y1;
		y1 = tmp;
	}
	var dx = x2 - x1;
	var dy = y2 - y1;

	if( dy == 0 ) { // horizontal line
		drawrectangle( "blackrectangle", y1 - width / 2, x1, dx, width );
		return;
	} else if ( dx == 0 ) { // vertical line
		if( dy < 0 ) {
			y1 = y2;
			dy = -dy;
		}
		drawrectangle( "blackrectangle", y1, x1 - width / 2, width, dy );
		return;
	}
	var slope = dy / dx;
	if( slope > 1 || slope < -1 ) {
		// one x per multiple y
		if( y1 < y2 ) {
			y = y1;
			for( x = x1 ; x < x2 ; x += 1 ) {
				nexty = y + slope;
				drawrectangle( "blackrectangle", y, x - width / 2, width, nexty - y

);
				y = nexty;
			}
		} else {
			y = y1;
			for( x = x1 ; x < x2 ; x += 1 ) {
				nexty = y + slope;
				drawrectangle( "blackrectangle", nexty, x - width / 2, width, y -

nexty );
				y = nexty;
			}
		}

	} else {
		// one y per multiple x
		if( y1 < y2 ){
			x = x1;
			for( y = y1 ; y < y2 ; y += 1 ) {
				nextx = x + 1 / slope;
				drawrectangle( "blackrectangle", y - width / 2, x, nextx - x, width

);
				x = nextx;
			}
		} else {
			x = x2;
			for( y = y2 ; y < y1 ; y += 1 ) {
				nextx = x + 1 / slope;
				drawrectangle( "blackrectangle", y - width / 2, nextx, x - nextx,

width );
				x = nextx;
			}
		}
	}


}


function jgptdiff( fn, x, delta ) {
	var rval = new jgpoint();

	rval.x = x;
	rval.y = -( fn( x ).y - fn( x + delta).y) / ( delta );
	//bit of a hack to keep the integration function from reseting
	return( rval );
}

function jgdiff( fn, delta ) {
	var rval = function( x ) {
		return jgptdiff( fn, x, delta );
	}
	return rval;
}

function jgptint( fn, x, delta ) {
	var rval = new jgpoint();

	rval.x = x;
	rval.y = fn( x - delta ).y * delta;
	return( rval );
}

function jgint( fn, delta ) {
	var sum = 0;
	var lastx = 1000;
	var rval = function( x ) {
		if( x < lastx ) {
			// assume new integral, reset
			sum = 0;
		} else {
			delta = x - lastx;
		}
		var pt = jgptint( fn, x, delta );
		sum += pt.y;
		pt.y = sum;
		lastx = x;
		return( pt );
	}
	return rval;
}

function xsquared( x ) {
	var rval = new jgpoint();

	rval.x = x;
	rval.y = x * x;
	return( rval );
}


function drawcurve( curvefn, coord, fnstart, fnstop, delta ) {
	var pt;
	var fofpt;
	var screenpt, newscreenpt;

	fofpt = curvefn( fnstart );
	screenpt = coord.pointToScreenCoordinates( fofpt.x, fofpt.y );
	for( pt = fnstart + delta ; pt < fnstop ; pt += delta ) {
		fofpt = curvefn( pt );
		newscreenpt = coord.pointToScreenCoordinates( fofpt.x, fofpt.y );
		if( screenpt.x != newscreenpt.x || screenpt.y != newscreenpt.y ) {
			drawline( 4, screenpt.x, screenpt.y, newscreenpt.x, newscreenpt.y );
			screenpt = newscreenpt;
		}
	}
}

function makefn( formula ) {
	var rfn = function( x ) {
		var rval = eval( formula + ";" );
		return rval;
	}
	return rfn;
}

function makepathfn( xfn, yfn ) {
	var rfn = function ( t ) {
		var pt = new jgpoint();

		pt.x = xfn( t );
		pt.y = yfn( t );
		return( pt );
	}
	return rfn;
}


var integratex = integrate( "x" );
var differentiatex = diff( "x" );

function jggraph( coord ) {
	var xformula = document.forms[ "jg_input"].elements[ "xformula" ].value; //"x*x;";
	var yformula = document.forms[ "jg_input"].elements[ "yformula" ].value; //"x;";

	var xfn = makefn( xformula );
	var yfn = makefn( yformula );
	var pfn = makepathfn( xfn, yfn );

	var mstart = parseFloat(document.forms[ "jg_input"].elements[ "meshstart" ].value); //;
	var mstop = parseFloat(document.forms[ "jg_input"].elements[ "meshend" ].value); //;
	var msize = parseFloat(document.forms[ "jg_input"].elements[ "meshsize" ].value); //;

	coord.scaleToCurve( pfn, mstart, mstop, msize );

	drawcurve( pfn, coord, mstart, mstop, msize );
}
</script>
</head>
<body>
<div class="jgdialog">
<form id="jg_input">
<table>
<tr><td>Y equation:</td><td><input name="yformula" value="x*x" /></td></tr>
<tr><td>X equation:</td><td><input name="xformula" value="x" /></td></tr>
<tr><td>Path start:</td><td><input name="meshstart" value="-1" </td></tr>
<tr><td>Path end:</td><td><input name="meshend" value="1" /></td></tr>
<tr><td>Mesh size:</td><td><input name="meshsize" value="0.1" /></td></tr>
<tr><td></td><td><img id="start_calc" src="jggraph.jpg" onClick="javascript:jggraph(unitsquare)"

/></td></tr>
</table>
</form>
<script type="text/javascript" >
drawrectangle( "whiterectangle", 0, 0, "100%", "100%" );  // make a background rectangle, not

necessary with default browser settings
var unitsquare = new jgcoordinates();

yaxis1 = unitsquare.pointToScreenCoordinates( 0, unitsquare.y1 );
yaxis0 = unitsquare.pointToScreenCoordinates( 0, unitsquare.y0 );
drawline( 1, yaxis0.x, yaxis0.y, yaxis1.x, yaxis1.y );
xaxis1 = unitsquare.pointToScreenCoordinates( unitsquare.x1, 0 );
xaxis0 = unitsquare.pointToScreenCoordinates( unitsquare.x0, 0 );
drawline( 1, xaxis0.x, xaxis0.y, xaxis1.x, xaxis1.y );
</script>
</body>
</html>
key function of this lesson
function jggraph( coord ) {
	var xformula = document.forms[ "jg_input"].elements[ "xformula" ].value; //"x*x;";
	var yformula = document.forms[ "jg_input"].elements[ "yformula" ].value; //"x;";

	var xfn = makefn( xformula );
	var yfn = makefn( yformula );
	var pfn = makepathfn( xfn, yfn );

	var mstart = parseFloat(document.forms[ "jg_input"].elements[ "meshstart" ].value); //;
	var mstop = parseFloat(document.forms[ "jg_input"].elements[ "meshend" ].value); //;
	var msize = parseFloat(document.forms[ "jg_input"].elements[ "meshsize" ].value); //;

	coord.scaleToCurve( pfn, mstart, mstop, msize );

	drawcurve( pfn, coord, mstart, mstop, msize );
}
key html of this lesson
<form id="jg_input">
<table>
<tr><td>Y equation:</td><td><input name="yformula" value="x*x" /></td></tr>
<tr><td>X equation:</td><td><input name="xformula" value="x" /></td></tr>
<tr><td>Path start:</td><td><input name="meshstart" value="-1" </td></tr>
<tr><td>Path end:</td><td><input name="meshend" value="1" /></td></tr>
<tr><td>Mesh size:</td><td><input name="meshsize" value="0.1" /></td></tr>
<tr><td></td><td><img id="start_calc" src="jggraph.jpg" onClick="javascript:jggraph(unitsquare)"

/></td></tr>
</table>
</form>
links to further information on the key points of this hub
- Using JavaScript and forms - JavaWorld
Javascript wears many hats. You can use JavaScript to create special effects. You can use JavaScript to make your HTML pages "smarter" by exploiting its decision-making capabilities. And you can use JavaScript to enhance HTML forms. This last applica - JavaScript eval() Function
Free HTML XHTML CSS JavaScript DHTML XML DOM XSL XSLT RSS AJAX ASP ADO PHP SQL tutorials, references, examples for web building.


