- HubPages»
- Technology»
- Computers & Software»
- Computer Software»
- Office Software Suites»
- Microsoft Office
Differentiating excel rows using color pattern for easy visualization
Let’s face it, even though Excel is the most amazing spreadsheet management software in the universe many of the users face problems with its visual aspects. As the gridlines are identical everywhere, you find it difficult to input data in cells when you are doing data entry or tracing a cell through following its row. Well, here we are here to discuss a smart trick with which you can overcome the problem really easily.
Get yourself ready
To do and show the process we are using a computer which has Microsoft Excel installed in it. In this tutorial, we have presented the process using Microsoft Excel 2010. The position of the tools which has been used in the tutorial might exist in some other position in the other versions of the software.
Steps for Differentiating excel rows using color pattern for easy visualization
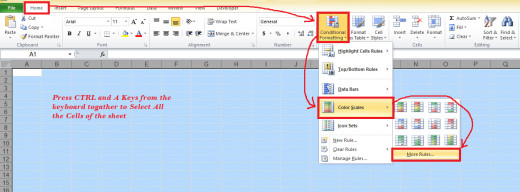
Step 1: Select any of the cells of the spreadsheet and then press CTRL and A key together from your keyboard to select all the cells of the entire spreadsheet.
Step 2: Select the Home tab from the Excel Ribbon of the software interface.
Step 3: From the Style portion of the Home Toolbar- click on Conditional Formatting option.
Step 4: Put your cursor on Color Scale option of the cell and as the sub-menu opens up, Select the More Rules option.
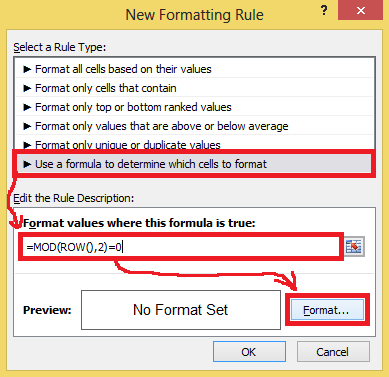
Step 5: As the New Formatting box opens up, select the Rule Type which says- Use a formula to determine which cells to format
Step 6: At the Empty Textbox below- write down the following formula-
=MOD(ROW(),2)=0
Step 7: Click on the Format button.
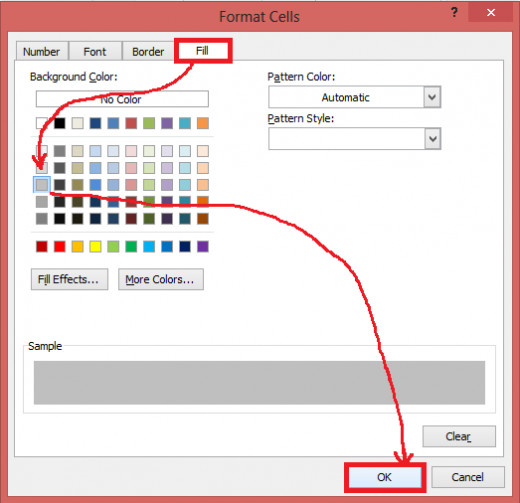
Step 8: As the Format Cells box opens up, select the Fill Tab of the box.
Step 9: Select any of the colors with which you want to differentiate the Row along with white rows. After that Click on the OK button.
Step 10: Now, we are back to New Formatting Rule box. Click on the OK button to apply the process in the spreadsheet.
How the process works
Actually the formula we have used here is the technique to identify all the even rows. Then it gets to apply the color to the identified rows at once through the formatting we have directed it through, that means applying the color to the even rows of the spreadsheet.
Think more
While choosing the color for the rows, consider the color of font we are using in the spreadsheet’s cells. Make sure you have chosen a color which has a good contrast with the font’s color thus it is easily readable to the viewers.

