- HubPages»
- Technology»
- Computers & Software»
- Computer Software
Filtering and Grouping data in Excel 2007

Introduction
Hi and welcome to my hub on using filters and groups to organise your data in Excel 2007. Using filters will allow you to sort your data based on any characteristic of your data that you desire. You can use any one of the numerical filters available; Excel 2007 has everything from averages and a top ten to greater than or less than. In addition, you can filter text using and / or statements using for example, contains or ends with. Filters allow you to drill down into your data with ease and find records that fit any criteria you choose.
Grouping allows data to be tied together in groups. These groups can be expanded or collapsed and sub-groups can also be created within groups. This allows very large data sets to be organised and summarised in a structured manner to make the data easier to understand by effectively hiding data within groups. An example of where grouping is very useful is for inventories. If you had an inventory of all software installed on every computer in your business, grouping the software installed first by vendor for example Adobe, then by application for example Adobe Acrobat, then by version would allow you to collapse a large amount of data into meaningful and useful groups. It would be visually very easy to find which computers in your organisation have Adobe Acrobat 9.0 installed using grouped data.
Configuring Filtering
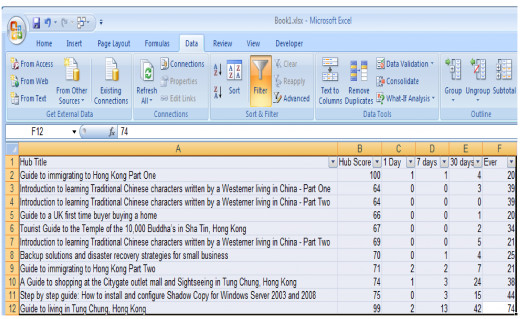
The configuration of filtering is very straightforward. Firstly, select the data you wish to have filters applied to and go to the Data tab and then select Filter. There is also Advanced to the right of the filter button which allows you to copy the data to another location should you wish to.
Once you apply filtering to your data, Excel will add drop down boxes to the top of each column to allow you to filter data based on the data in the column selected (as shown below). You may also need to resize the columns to display the data in the columns as well as the drop down boxes.
Applying a numerical filter
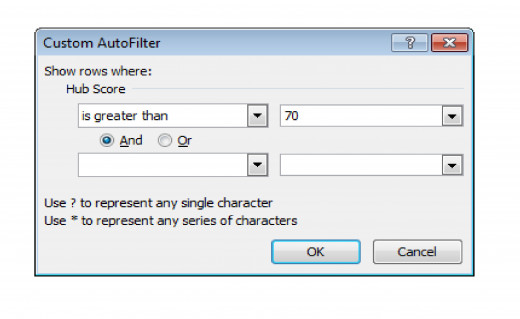
To apply a filter to your data, select the drop down box that corresponds to the data you wish to use as the basis for your filter. In my case, I wish to know which of my hubs have a hub score of 70 or above. I select the drop down box; click on Number Filters and then choose Greater than. I then enter 70 into the right hand box and click OK.
The drop down box will then change to indicate that a filter has been applied to that row. To clear a filter, click on the Clear button to the right of the Filter button on the Data tab.
Further sorting can be done using the Sort Smallest to Largest and Sort Largest to Smallest buttons to the left of the Filter button.
Applying a Text Filter
As well as filtering using numerical filters, you can also use text based filters. If I want to list all my hubs with Tung Chung in the title, I can do this using text filters. Select the drop down box of your column containing text and select Text Filter and then Contains. Type whatever text you want to filter by in the box to the right of contains and click OK. This will then filter your data based on the text you specified.
Grouping Data
Before actually grouping the data, it is important to have a clear understanding of how you want the data to be grouped and ensure that the data is ordered correctly to allow that grouping. The reason for this is that once grouped, data has to be ungrouped before it can be moved. For my example, I will be grouping data taken during a software inventory.
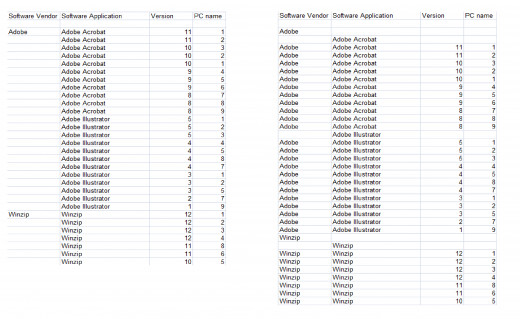
In addition, to keep the titles of each group clean, it is a good idea to put a blank record with just the title at the top of each row as shown below. To illustrate this, I have my spreadsheet before and after this formatting below (I didn’t create labels for Version to ensure it fitted onto one screen).
Once your data is in ordered correctly, the actual grouping is very straightforward.
IMPORTANT: There are a few things to bear in mind when creating your groups.
- When grouping work from right to left.
- Select all the items in your columns (or rows) that you wish to group excluding the top (or left most item). These will become the label of your group.
To begin grouping my data, I begin with grouping the Version column, then the Software Application column before finishing with the Software Vendor column remembering not to use the top item as it will become the label. Once I have created all my groups, the spreadsheet looks like this…
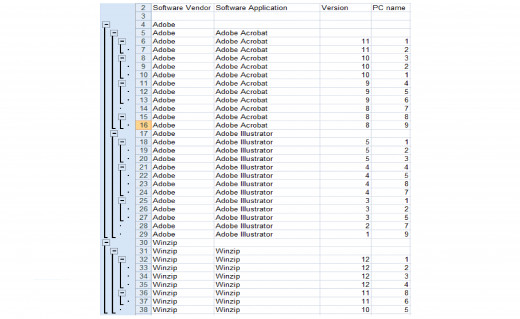
Once the data is grouped, anyone who uses the spreadsheet can choose which data that want to drill down to and effectively ignore the rest. If someone wants to know just which PCs have Adobe Illustrator 5 installed, they just need to open those groups to find that out. All the data pertaining to other vendors or to other Adobe software applications can easily be ignored by simply not expanding the groups.
Ungrouping data
To ungroup data, simply select the data you wish to ungroup and select the Ungroup button on the Data tab. Excel 2007 will ungroup the data starting with the groups on the left working right each time you click it.
Conclusion
In this hub, I have explored using the Filter and Group functions in Excel 2007.
Filtering allows you to display only data that meets the criteria (both numerical and text based) that you chose. This allows you to perform further calculations on subsets of your data easily.
Grouping allows you to organise your data into groups so that very large amounts of data (for example a software inventory) can be organised and then collapsed into groups containing similar identifying factors (such as a group for all software from Adobe). A user of your document will see a list of vendors each of which contains groups of software and so on, rather than screens and screens of data.
I also have a number of other hubs on aspects of Excel 2007, covering everything from Conditional Formatting to creating charts and graphs. I have an Index hub which also covers how I successfully transitioned from Excel 2003 to 2007 as well as outlining my other Excel 2007 hubs which can be found here
I hope that you found this hub useful. Good luck with your adventures using Excel 2007! Please feel free to leave any feedback or comments you may have below.
Related

How to create a thematic or Choropleth map in Excel 2007 and Excel 2010

Common Lotus Notes Problems - and A Few Solutions

How to use, create and configure ActiveX Controls List Boxes in Excel 2007 and Excel 2010

Creating an Amortization loan or mortgage schedule using Excel 2007 and Excel 2010

How to use the Excel 2007 and Excel 2010 Solver Tool in a spreadsheet for solving problems and optimization


