Forecasting COVID-19 Cases using Facebook's Prophet


Prophet is an Open Source library developed by Facebook. Prophet is used to make time series forecasts with fairly good accuracy. Prophet uses a decomposable time series model which has following three main components
- Trend
- Seasonality
- Holidays
Prophet has following advantages:
- Accurate & Fast
- Fully Automatic
- Tunable Forecasts
- Available in R/Python
To define prophet forecasting model in python, the Prophet() is used which takes following parameters:
Trend Parameters
- growth
- changepoints
- n_changepoints
- changepoint_prior_scale
Seasonality Parameters
- yearly_seasonality
- weekly_seasonality
- daily_seasonality
- seasonality_prior_scale
Holiday Parameters
- holidays
- holiday_prior_scale
Prophet can be used to predict/ forecast COVID-19 cases. In next few lines I'll be explaining how to achieve this. I am using Google Colab's jupiter notebook in this tutorial. You may choose any other python IDE. The code will run unchanged across all IDEs.
Before we can use Prophet, it should be installed in the environment. To install use following command.
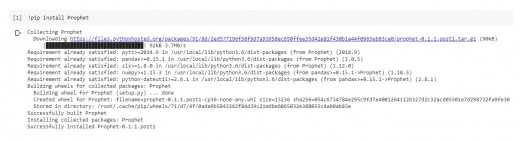
pip install Prophet
following is the output you get when installing Prophet in Google Colab.
After installing the Prophet we require some python libraries which can be imported in the code as follows:
import pandas as pd
from fbprophet import Prophet
from fbprophet.plot import plot_plotly, add_changepoints_to_plot
After importing the libraries we need COVID-19 data on the basis of which we can forecast. The data of COVID-19 confirmed cases can be obtained from time_series_covid19_confirmed_global.csv file available on githubusercontent.com using pandas as follows:
confirmed_df = pd.read_csv('https://raw.githubusercontent.com/CSSEGISandData/COVID-19/master/csse_covid_19_data/csse_covid_19_time_series/time_series_covid19_confirmed_global.csv')now we need to create a data frame and specify the following variable names required by Prophet:
- y – Target
- ds – Datetime
and convert the data frame according to specification as given below
k = df[df['Country/Region']=='India'].loc[:,'1/22/20':]
confirmed = k.values.tolist()[0]
data = pd.DataFrame(columns = ['ds','y'])
data['ds'] = dates
data['y'] = confirmed
In the above code, I am using country/region as India. You may use any country for prediction.
Now fit the prophet model. The interval_width is used to specify confidence interval and periods is used to specify number of days to forecast into the future.
prop = Prophet(interval_width=0.95)
prop.fit(data)
future = prop.make_future_dataframe(periods=20)
Following is the complete code that you may copy and paste.
# Complete Code

import pandas as pd
from fbprophet import Prophet
from fbprophet.plot import plot_plotly, add_changepoints_to_plot

confirmed_df = pd.read_csv('https://raw.githubusercontent.com/CSSEGISandData/COVID-19/master/csse_covid_19_data/csse_covid_19_time_series/time_series_covid19_confirmed_global.csv')

dates = list(confirmed_df.columns[4:])

df = confirmed_df.groupby('Country/Region').sum().reset_index()

k = df[df['Country/Region']=='India'].loc[:,'1/22/20':]
confirmed = k.values.tolist()[0]
data = pd.DataFrame(columns = ['ds','y'])
data['ds'] = dates
data['y'] = confirmed

prop = Prophet(interval_width=0.95)
prop.fit(data)
future = prop.make_future_dataframe(periods=20)

forecast = prop.predict(future)
confirmed_forecast_plot = prop.plot(forecast)
output will be as follows:
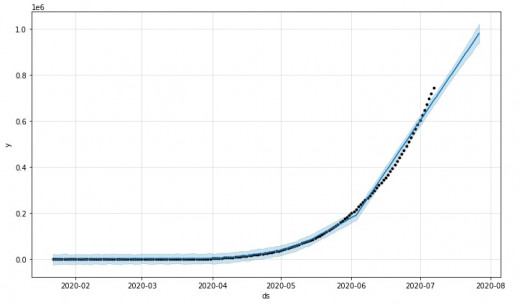
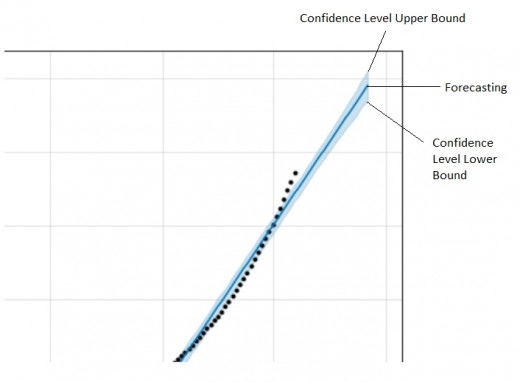
in the graph blue line indicates actual forecasting and light blue shades indicates confidence level.