How Thermography Reduces Maintenance Costs, Condition Based Maintenance
Thermal Imaging Condition Monitoring

Thermography as Preventative Maintenance
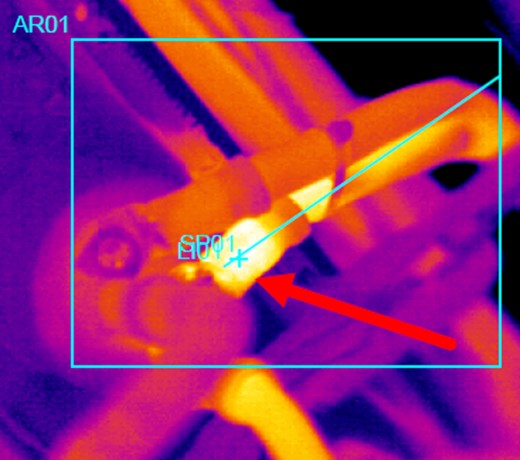
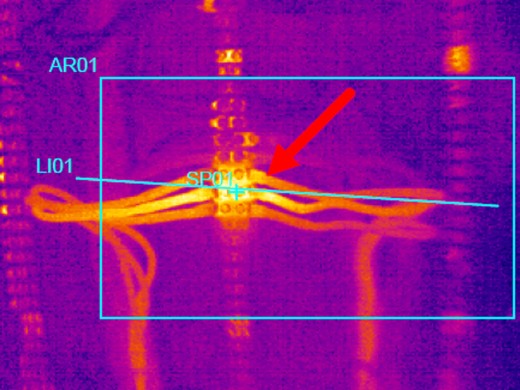
As a thermographer I view equipment operations differently than when I was young. Now I see them as operations using large equipment that need regular maintenance and which can benefit from preventative or condition based maintenance to prevent premature shut downs, equipment failures, to help predict which equipment will need to be replaced and when, and to prolong the life if the current equipment. But thermography is a major key to maintaining productivity.
The Best Nondestructive Testing Methodology
Thermographic analysis helps maintain operating equipment with what is arguably the best all-around non-destructive testing which is useful during operations without interrupting the operations themselves.
All aspects of operations, electrical, substations, overhead wiring and connectors, field pumping stations, pumps, loading facilities, dredges, barges, ship operations at all levels including lighting panels, and Motor Control Centers, and other equipment, concentrators, pumps and motors all benefit from biannual inspection schedules.
All complex businesses that use equipment ought to have a similar schedule by qualified thermographers with at least a Level II Certification and five to ten years of experience in the field.
Operations which move large mass (sand, soils, water, petroleum) require large equipment and large amounts of energy, both of which are subject to factors causing said equipment to move from a near pristine state to a failure state more rapidly than in market sectors using smaller equipment and less energy.
This should be obvious; however, less obvious is the cost savings to management and the bottom line of operations achieved by application of thermographic analysis.
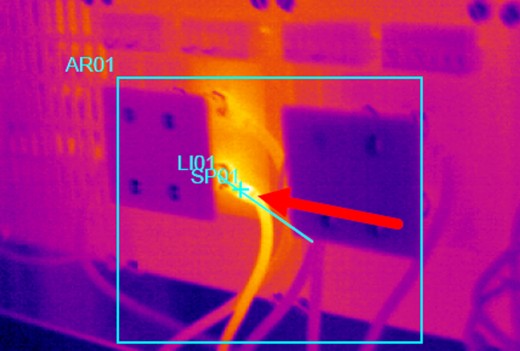
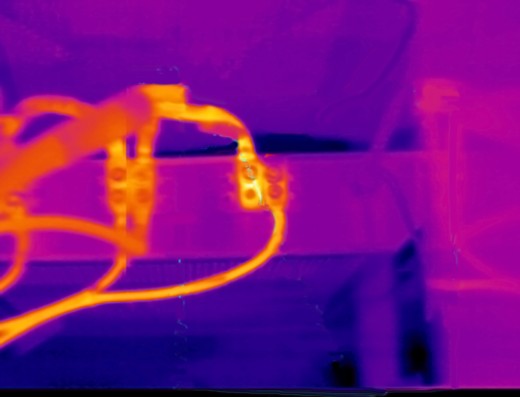
A technician trained in thermography can see very small rise in thermal energy given off by mechanical and electrical problems before they lead to excess wear and failure so the engineering staff can effect corrections, such as a change of lubricant or alignments before critical failures which close plants.
My experience with very large equipment is seen in many millions of dollars saved through predictive and condition based maintenance and production increased by preventing plant closures from items as simple as breakers with worn connectors or s complex as power supplies to various sensors with bad connections or failing components.
A simple undetected bad contact in the right location can shut down operations causing millions of dollars in lost production by an unexpected shut down. In the petroleum industry this can mean ten million dollars a day or more of lost productivity.
Increased use of thermographic inspections and analysis in mining operations has resulted in many companies in the US, Canada, and Australia seeing profits increase as operations become more reliable and maintenance costs are controlled, and the reliability in mechanical and electrical components is enhanced at all levels.
It is little wonder the industry is seeing a spike in the application of thermography in sectors such as mining, drilling, and petroleum production facilities. Frankly, it is little wonder insurance companies have been using this analysis to reduce risk on their client’s assets.

Cost Reduction Through Thermographic Inspections
An important aspect of the thermography estimating the cost savings of inspections. This is important to understanding the efficiencies achieved by this important analysis. An important aspect of the work of any good thermographer is estimating the cost savings of thermographic inspection services to help managers understand and justify their expenditures. This is perhaps the second most rewarding aspect of thermography, the first being saving lives by fire avoidance.
Enormous costs can be incurred and are incurred annually by industry and ships where equipment failure would otherwise lead to fire or other damage, and consequential loss of profits and increased operating costs, and affect many budget categories usually unnoticed because they are so diverse.
Lost revenues to land based and maritime operations by the failure to inspect ships reached easily into the hundreds of millions of dollars annually as evidenced by the nearly biannual major ship fires costing an average of $500,000,000 when all expenses are calculated (see Testimony of Ross A. Klein, PhD Before the Senate Committee on Commerce, Science, and Transportation, Tuesday March 1, 2012), or worse, the nearly biennial ship lost at sea due to fire or scrapped after a fire.
While much of the work I have done is in the marine world, this is just as true in the industrial sectors.
This is a tremendous and largely preventable waste of resources.
A significant segment of thermographic inspection reports should be comprised of cost savings data to help managers understand the cost saving generated by the thermographic inspection team.

Updating Data
In times past this was done simply by estimating the replacement costs of the particular piece of equipment. Questions arose at times for those using higher numbers and justification of this practice, which is actually quite easily done.
During this time, and on a specific day, these expenses occurred to me. The event happened when riding the USS Kitty Hawk from the yard at Philadelphia after her final refit in 1991. The thermographer found a relatively large item, informed the Warrant Officer on site of the impending fire. He informed the thermographer that the captain would not delay sea trials for such a problem, and so we awaited the results.
The resulting fire gave the Captain no choice but to delay the ships sea trials for three days which the crew synthesized a replacement parent that could have been corrected in a matter of hours by delaying the sea trials. I started thinking about the cost of a warship of this magnitude with 4500 men aboard delayed for three days.
There is little hope for managers on land or sea if they are going to ignore the experts they hire.
Ships and industrial facilities have normal compliments of fixed and variable costs incorporated into cost and profit predictions. When equipment is operating normally each item has a fixed cost, a variable cost and generates a contribution to the overall business profit.
It is reasonable to look at every machine and various equipment in the operations as contributing to the total profit of the business. When equipment cannot be used it cannot contribute to profit, however, it may contribute significantly to business losses. If the reason it is not operating is because it has failed, then not only is it not contributing profit, it also imposes added equipment repair costs to the company.
When failure is a critical failure, the results can at times are fatal to workers.
Cost Categories
To understand the cost savings of a qualified thermography inspection one needs to know the total costs of equipment failure. This varies considerably as to where the equipment is operating and the availability of replacement of course, so let’s simply examine the categories of costs incurred.
Labor Costs
Labor costs include direct and indirect costs, overhead, possible subcontracting expenses, overtime, consequential labor cost, and potential machinery room expenses if a component replacement. There are operators, maintenance and repair engineers, supervisors, and management costs incurred with each event, and add to this administrative labor, accounting, shipping, receiving, transportation to the site or ship. When taking of Oil Sands in, say, Ft, McMurray, the cost is similar to an off shore pumping platform in the Gulf of Mexico.
Service Costs
Possible costs for services include the cost of extinguishing a fire caused by the failing equipment, which is more common that one might expect, the cost of replacing or recharging firefighting equipment, the cost of cleanup, elevated insurance costs, the cost of follow-up investigations by the ship’s crew, the owner and manager of the ship, insurance companies, and agencies having authority in the specific case. Call out charges for special services which when a ship is at sea may include firefighting, towing, passenger transfers, or simply delivery of replacement components, removal, disposal, and installation costs. Travel time for crew needs to be added, and lastly time lost on other work.
Product Costs
In this category we have to distinct possibilities, the product being delivered by the equipment that fails, say, food for the crew or passengers, which happens in kitchen and refrigerator equipment failures or fires. In which cases you need to calculate lost food, waste disposal, and replacement of food. Or in the case of refrigerated shipping, very high but insured cost of replacement of products spoiled. However, it can also mean the primary or secondary waste treatment equipment not being able to treat waste resulting either in the inability for waste disposal for individuals or the dumping of untreated waste overboard and concomitant fines as defined by what was jettisoned and where. All in this category can have significant impacts on the good will value of the ship and the company operating it. Assessing lost good will is more difficult as it is an intangible asset.
Lastly, there is the waste produced by the failure. This can be as small as the waste generated by a failed circuit breaker or as great as the loss of a ship and lives at sea. This happens too.
Material Cost
Direct material costs include the replacement and disposal of the effected equipment, the effect on inventory, shipping, receiving, and testing of new equipment, failures during break-in time, and the overhead costs associated with those activities such as staff time ordering, and handling the equipment, and quality control issues.
But these can, according to the situation effect other equipment. A failure that leads to a system wide shutdown may include lost fuel when the engines are shut down due to delayed departure, then the expense of restarting the engines, and possibly replacing lost fuel outside of normal fuel cost replacement due to location or other contractual restraints.
Capital Expenditures
Ships fall into three major categories, military, cargo or passenger. All have their respective capital expenditures when the ship is delayed beyond the loss of good will (see Part 2). On ships and land insurance often covers losses, but cost the company since insurance companies increase premiums.
If one piece of equipment repeatedly fails either increased inventory costs are incurred or emergency replacement costs are experienced. Planning, supplier considerations, alteration options, scheduling, audits, and invoicing all impact operations.
Failure prevention produces significant cost savings.
Other Costs
Calculations consider cost of replacement also, and compare them to nearly a decade of insurance company data from the 1990s, adjusted for inflation.
Property Damage Cost needs consideration as well as Business Interruption Cost in addition to loss of use.
Reports from the 1970’s were good, cost savings (comparing Run-To-Failure Cost against Repair-As-Found Cost) were estimated in the $300,000 to $700,000 range per report, and so the ROI to the company ranges from some thirty times to well into the one hundred times return.
When all factors were calculated, it was clear these estimates, while sufficient to generate interest from C Level management and above, turned out to be deceptively conservative as it was later realized the average cost of an MCC fire was not limited to the specific item, rather effected the categories above. Equipment costs may mean replacing many other components and a collateral damage since many if not most equipment failures result in what is classed as a “small” fire.
Having said that, a failure and small fire in a Motor Control Center (MCC) which may seem to involve, say, one motor controller actually ends up with significant damage to multiple motor controllers and power distribution centers and the average cost is now considered by insurance companies to be above $1,000,000 per event, and the typical small electric fire can exceed $790,000 when all costs are reflected in the estimate.
The resultant values produced by a more thorough consideration of total costs from individual problems now range in the range of $3,000,000 to $20,000,000 per inspection on ships and many industrial locations.

Conclusion
The use of more accurate data in calculating cost savings by qualified thermographers reflects the growth of demand for thermographic inspections in the manufacturing, industrial, equipment and marine applications for predictive maintenance and reflects the 2005 statement by Lloyd’s register “In the near future, mechanical machinery onboard vessels will also benefit from thermal imaging, especially as a pre-docking strategy to identify and target equipment and systems which need attention as well as to eliminate necessary work.”
What they apparently didn’t know was several companies had been inspecting ships for more than twenty years by that time.


