Introduction to Debugging in Java and Netbeans
Netbeans provides powerful support for debugging your Java programs. In this tutorial we look at the basics of debugging, primarily setting breakpoints in a program and querying values during program execution.
Figure 1 illustrates a simple Java program. The program doesn't accomplish much; it's just intended as a starting point for our tutorial.
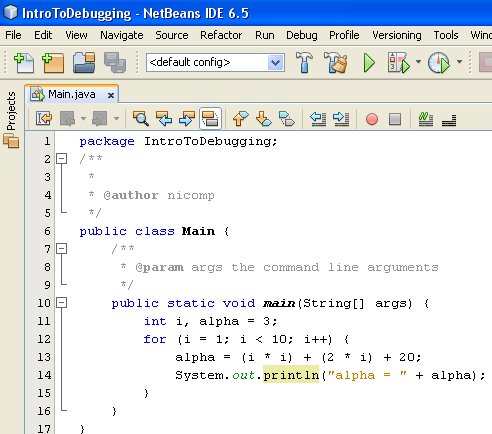
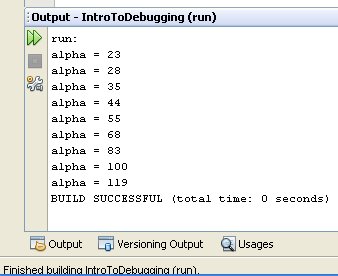
Our program contains a print statement. Such a statement is the most elementary form of debugging. Figure 02 illustrates the output generated by the program.
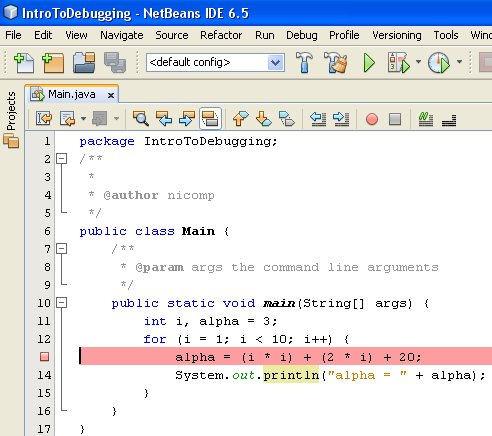
Let's take the next step and use the debugging tools provided by Netbeans and Java. In Figure 03 we set a breakpoint. The breakpoint will cause the program to pause so we can examine what it's up to while it's still running.
We don't have to execute the program by hand. We set the breakpoint, start the program in Debug Mode, and wait for the breakpoint to get hit.
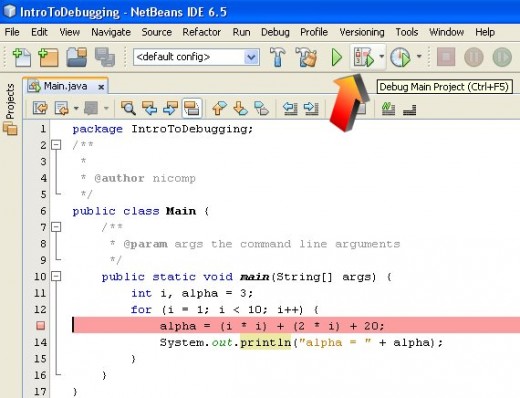
The next step is to run the program, but we have to run it in a special way to take advantage of the breakpoint. Figure 04 shows how to launch the program in Debug Mode.
in Debug Mode, the program will stop on breakpoints. Debug Mode causes the program to run more slowly than non-Debug Mode, but that's a small price to pay for the power and flexibility of debugging. Debug Mode has a negligible effect on most small programs.
In Figure 05 the program has been launched in Debug Mode, it started running, ran up to the breakpoint, and paused. The next line to be executed is highlighted in green by NetBeans.
Note: be sure that your breakpoint will be in the execution path. If it's not in the execution path, it won't cause the program to pause. That can get frustrating.
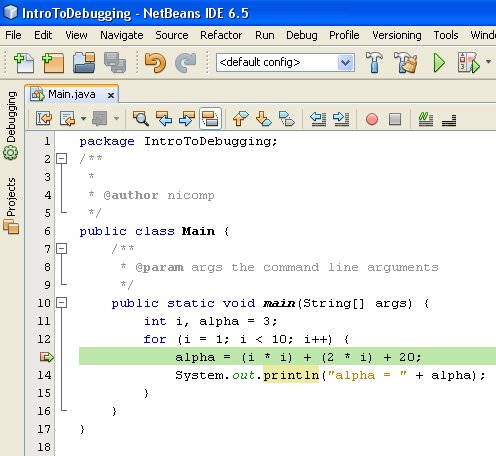
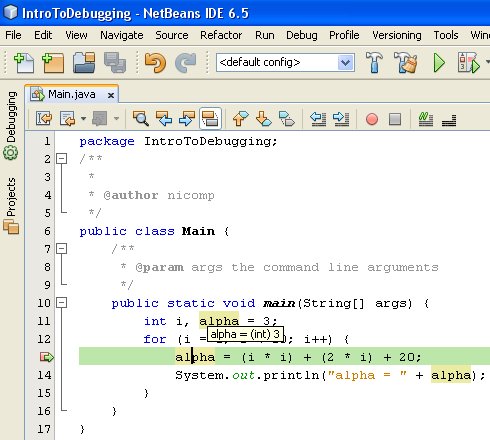
This is the good part. The program is in suspended animation. We can examine the state of the variables and learn precisely what is happening.
Remember that the green highlight is on the next line to be executed. The line of code has not been executed, yet.
In Figure 06 the mouse hovers over the variable alpha and NetBeans displays the current value of the variable in a context bubble. Very cool.
The value of alpha is 3 because it was initialized to that value in line 11, where it was declared.
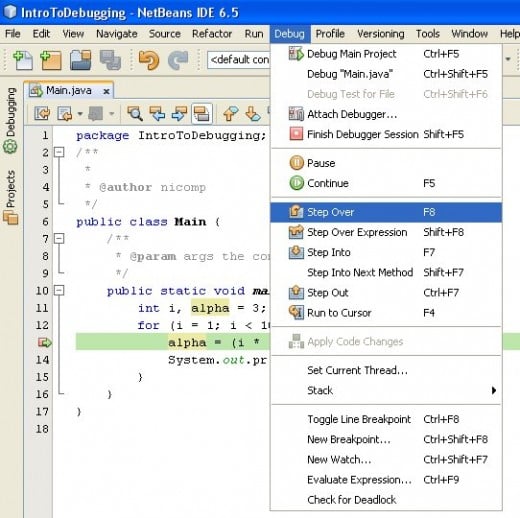
One more feature we will introduce is the concept of single-stepping. Since the green highlighted line has not yet been executed, we click Debug / Step Over (or press the F8 key) to excecute that line. The green highlight moves to the next line in the program.
You can use single-stepping to follow the code path of your program and find logic errors lurking deep within your code.


