My Weather Station With Arduino

Weather Station - Version 1
When I started to develop my first meteorological station I had many doubts and concerns and I found that there was very little information about it on the internet and that there were many brands of different characteristics in the electronics market. I was clear that I wanted a weather station that I could do to my own taste and that I could modify it when I wanted it and that it would cost much less to make it than to buy it.
A practical tool to do it was with Arduino UNO as it is a very popular board and there are free libraries that you can download without any problem in the official Arduino page. To begin with, I bought the most commercial and economical sensors on the market to be able to experiment with them: Barometric Pressure Sensor BMP085 and Humidity Sensor DHT11; Both sensors have integrated a digital temperature sensor.
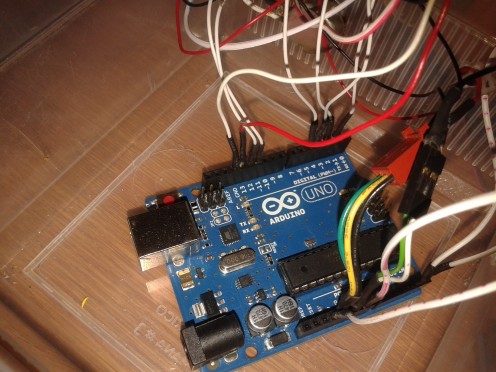
My first design develops and monitors the parameters of relative humidity, ambient temperature and barometric pressure in the serial port, and the next picture shows the connections.
A Meteorological Station has many applications, and just to give some examples I show the following: at home I can be used to monitor the humidity, temperature and atmospheric pressure in the home or in my greenhouse. In the industry you can use to control the humidity in a store that contains cartons and in the school for laboratory experiments.
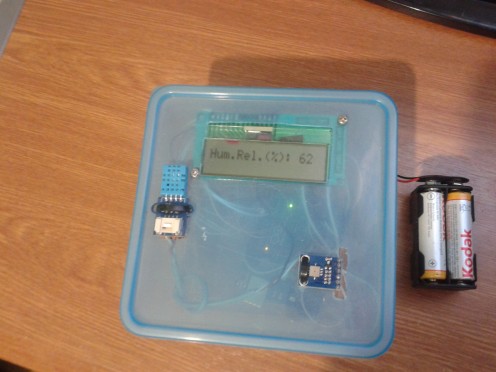
Then use the same project and add a 16x2 LCD display to see the parameters on a screen, the next picture shows its operation.
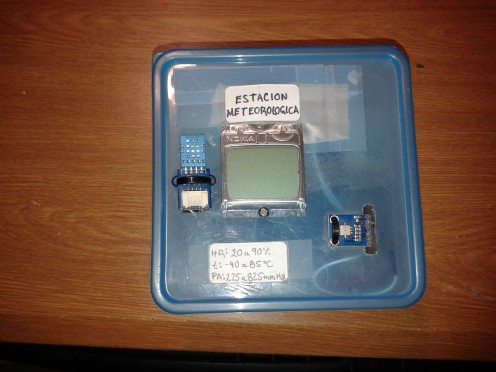
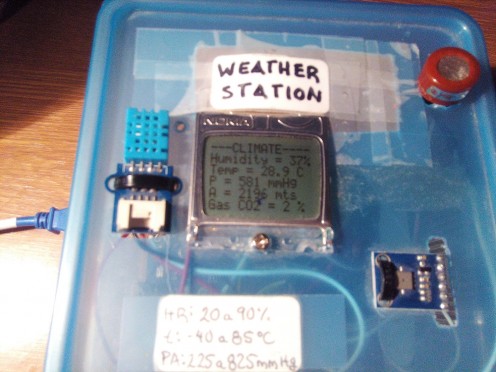
As there were several parameters that had to be monitored and I could not see them simultaneously on the same screen, then I had to use a NOKIA 3310 screen of 48 x 84 pixels, the following picture shows its operation:
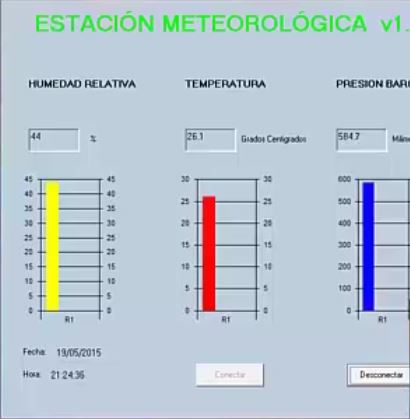
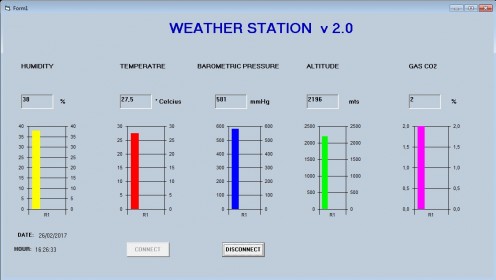
The work was being done perfectly and as I am very restless then I set myself the task of designing the interface to connect my weather station to my computer and to see the results numerically and graphically in real time on the screen of my computer. The software you used was Visual Basic 6 and the result can be seen in the following photo:
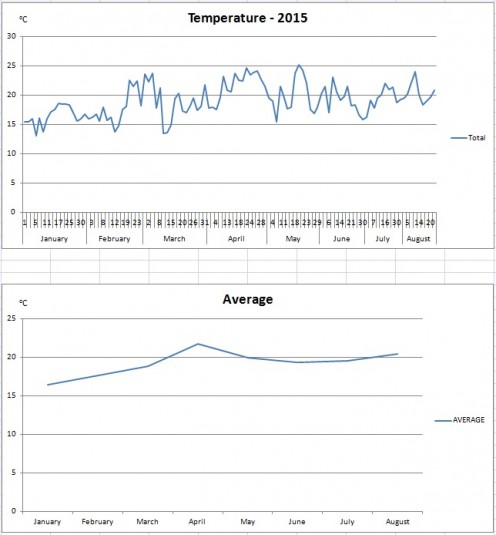
The results were very satisfactory and finally I gave the task of capturing the data of humidity, temperature and barometric pressure in a database like SQL SERVER 2013 free version. Everything worked very well and I did the monitoring for some months and the results can be observed in the following photographs:
Weather Station - Version 2
The last modifications I made to my weather station were as follows: Use the Mega 2560 board which has more ports, use the MQ7 carbon monoxide gas sensor. On the NOKIA 3310 LCD screen, add the calculated height values with the barometric pressure sensor BMP085 and also add the measured values with the MQ7 gas sensor. Also use these same values to graph them on my computer screen. These results can be seen in the following images:
Weather Station - Version 3
This is my last version of my Weather Station but with the following variant: Hardware is exactly the same as my second version with Arduino Mega 2560, simply that on this occasion I see the data of my sensors in an android application on my cell phone. This application is developed with Android Studio version 2.3.1, and it was really difficult because there is very little information to do this kind of thing besides the difficulty of programming with Java. The data are captured in real time and we can monitor these anywhere we locate and fence the bluetooth connection of our cell phone with the bluetooth HC-05 connected to the Arduino board. Many changes can be made to this project simply by understanding what has been done since version 1, such as using another display or other type of Bluetooth card or putting more or less sensors or modify our code android Studio.
Weather Station - Version 4
This is the latest version of my Weather Station. This time I am working with the Raspberry Pi Zero W card, which is connected to the humidity sensor DHT11 and the barometric pressure sensor BMP085. When the moisture, temperature, barometric pressure and altitude data are captured, the Raspberry Pi card sends them to the ThingSpeak server to store them in a database and then make their graph. Finally and when any parameter of temperature and humidity is exceeded beyond a programmed limit, then an alert is sent to my Twitter account and in this way we are warning of what is happening in real time.
© 2017 Guillermo Perez Guillen


 and Their Uses")


