Catastrophic Weather Cycles

Histroically, the weather can be extremely wild
We are all familiar with hurricanes, tornadoes and winter squalls. These are the annual fare that we experience in the form of catastrophic weather. But there are greater cycles as well as displayed in tree rings and ice cores. This site page has been inspired by emerging sciences and controversial modern findings regarding geological studies. Enter the complex multi-layered, multi-cycled phenomenon of global weather. We are all familiar with seasonal and yearly cycles. Some of us are familiar with cycles spanning decades and even centuries. But, for the really long ones covering thousands and hundreds of thousands of years, few are aware of these. Yet, these are supported by geological studies, particularly of the layers in the ice caps and ancient glaciers. There are other anomalies, like frozen mammoths, mass animal graves and periodic extinctions great and small. Perhaps the greatest influence on this page is the work, “The Coming Global Superstorm” by Art Bell and Whitley Strieber. This is also supported by historical accounts detailed in “Catastrophe” by David Keys.
What is proposed here is a mechanism of how the balance is upset to generate extreme weather; weather that can cause mass extinctions and cause the immediate extremes seen reflected in the ice cores and other sources that tell us of reversals over a span of a few years; virtually overnight on the geologic timescale.
Matter exists in four distinct states being, gas, liquid, solid and plasma. There are phase state changes within each type of condition that are tied to processes at the quantum level. For our purposes here, we are going to consider the transition point from gas to liquid. Our atmosphere is primarily Nitrogen, with Oxygen, Carbon dioxide and trace gasses. Each one has a liquefaction point that by our standards is extremely cold. This is critical for reasons we will be exploring. We know gas can condense into liquid and even solid because we extract these same gases by super-chilling the atmosphere to condense these gasses into liquid form. Almost everyone knows of liquid Nitrogen, Oxygen and dry ice (solid Carbon Dioxide). The table below lists the various “boiling points” of liquid gasses in their liquid state.
Gas
| Tc (oC)
| Pc (atm)
| BP (oC)
|
|---|---|---|---|
He
| -267.96
| 2.261
| -268.94
|
H2
| -240.17
| 12.77
| -252.76
|
Ne
| -228.71
| 26.86
| -246.1
|
N2
| -146.89
| 33.54
| -195.81
|
CO
| -140.23
| 34.53
| -191.49
|
Ar
| -122.44
| 48.00
| -185.87
|
O2
| -118.38
| 50.14
| -182.96
|
CH4
| -82.60
| 45.44
| -161.49
|
CO2
| 31.04
| 72.85
| -78.44
|
NH3
| 132.4
| 111.3
| -33.42
|
Cl2
| 144.0
| 78.1
| -34.03
|
Table 1 shows boiling point/condensation temperatures for N2 as -195.81 Centigrade and for O2 as -182.96 Centigrade. Methane (CH4) will condense and liquefy at -161.49 Centigrade and Carbon Dioxide will freeze out at -78.44 Centigrade. Each sample was measured at a specific pressure. In the upper atmosphere, things are much different. The pressure is much less than the critical pressures listed in the table. Thus, due to phase state characteristics of each gas, a colder temperature is needed to condense them to liquid. In the stratosphere, where temperatures can really drop, the first gas to condense is CO2 and this can readily occur in really cold areas of the planet and precipitate out as a type of snow. We do not readily see Nitrogen or Oxygen condense and rain out. This would require exceptional conditions. With heat being trapped in the troposphere by greenhouse gasses, the temperature of the stratosphere is dropping radically. It is of this writing now colder than -100 degrees Celsius. This means CO2 freezes out, falls and then vaporizes before reaching the surface. In Antarctica, it can actually reach the surface in mid winter. Sometimes in really cold winters, it can happen in Siberia. To liquefy some of the other gases would require the blocking out of the sun by some agent like a nuclear winter, comet or asteroid impact or a super-volcanic explosion. Myth contains hints of such events. Historians actually record such violence in the sixth century. Concurrently with temperature drops in the upper atmosphere, there has been noted a .5 degree Celsius rise in ocean surface temperature around the world.
Historically, according to studies of paleoclimatology as revealed in ice cores, seen in chart 1 above, there have been four major cycles between ice ages and warm periods with wide temperature swings. There may have been more, but these records do not exist for periods beyond 800,000 years. Other records of the earth indicate that ice ages have been the norm for at least three million years. There may have been a great melt down prior to 800,000 years ago which may account for the length of the record today, but thus is largely speculation. The Vostok ice core also shows radical swings within the larger cycles. These patterns are also found in other ice cores indicating changes of global proportions. These have as their causes, volcanic explosions, impacts from bolides, Milanokovich cycles, biological inputs, burn offs of biomass and other as yet unknown causes. Cold periods tend to be dry and warm ones wet, though not exclusively so. A more detailed study of the last twenty thousand years shows how quickly things can change. A dust spike some 4.49 thousand years ago may be the input from a volcanic eruption or something as simple as a world wide drought accompanied with wind kicking up dust. This should have cooled things down due to the obscuration of sunlight. The extent of the spiking is less then a century. According to some, this triggered a super-storm that was responsible for Noah’s flood. Flood legends are almost universal in the world’s cultures and legends. There is ample evidence of massive flooding around the world, but at a much earlier date, specifically at about 12,000 years ago. If this were volcanic in origin, then carbon dioxide as well as dust was released, and this melted a lot of ice. Unfortunately, the geological record indicates that the meltdown started about 12,000 years ago and there is no such spike. Other legends do tell of a super-volcanic explosion and great floods that ended an earlier civilization. Dated to 12,000 years ago are extinctions of many large mammals and the orientation of many megalithic artificial structures.
Ice core data going back 400,000 years

Historically, according to studies of paleoclimatology as revealed in ice cores, seen in chart 1 above, there have been four major cycles between ice ages and warm periods with wide temperature swings. There may have been more, but these records do not exist for periods beyond 400,000 years. Other records of the earth indicate that ice ages have been the norm for at least three million years. There may have been a great melt down prior to 400,000 years ago which may account for the length of the record today, but thus is largely speculation. The Vostok ice core also shows radical swings within the larger cycles. These patterns are also found in other ice cores indicating changes of global proportions. These have as their causes, volcanic explosions, impacts from bolides, Milanokovich cycles, biological inputs, burn offs of biomass and other as yet unknown causes. Cold periods tend to be dry and warm ones wet, though not exclusively so. A more detailed study of the last twenty thousand years shows how quickly things can change. A dust spike some 4.49 thousand years ago may be the input from a volcanic eruption or something as simple as a world wide drought accompanied with wind kicking up dust. This should have cooled things down due to the obscuration of sunlight. The extent of the spiking is less then a century. According to some, this triggered a super-storm that was responsible for Noah’s flood. Flood legends are almost universal in the world’s cultures and legends. There is ample evidence of massive flooding around the world, but at a much earlier date, specifically at about 12,000 years ago. If this were volcanic in origin, then carbon dioxide as well as dust was released, and this melted a lot of ice. Unfortunately, the geological record indicates that the meltdown started about 12,000 years ago and there is no such spike. Other legends do tell of a super-volcanic explosion and great floods that ended an earlier civilization. Dated to 12,000 years ago are extinctions of many large mammals and the orientation of many megalithic artificial structures.
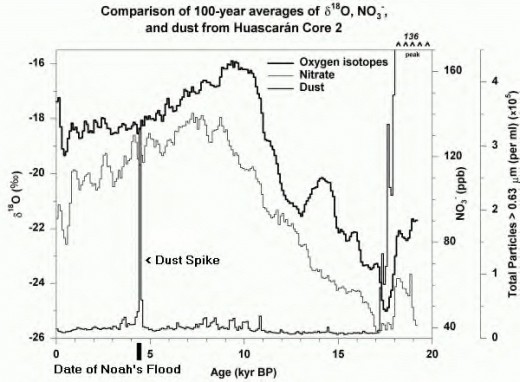
In the chart 2 below, there is a dramatic fall off of radioactive oxygen, increase of nitrates but little dust input for the period of 10,000 to 12,000 years ago. There is also a dramatic increase of Carbon dioxide as seen in chart 1. Between 12,000 and 14,000 years ago, is a smaller falling off of radioactive oxygen followed by an increase. The same era of 10,000 to 12,000 years also shows a warming trend in the Vostok ice core. A warming trend means more liquid water, less ice, hence inundation. The redistribution of mass can cause volcanic activity as we note today with meltdown going on, but nothing significant shows by way of dust from 17,000 to 11,000 years ago. But at 17,000 years ago, there is a huge spike. The information appears to be incomplete. As there is no prior start point. Coincident with that spike is a deep cold spell. This may have been a super-volcanic eruption. Carbon dioxide, which did increase can occur from other reasons. Quieter volcanic eruptions can inject vast amounts of CO2, as can the burning of a lot of biomass such as can occur during droughts. During warm wet periods, there is an increase of Methane in the atmosphere due to increased biological activity. Ocean currents can change due to such inputs and end up being the trigger for warming and cooling on a global scale. Of particular concern is the so called North Atlantic conveyer system that allows heat exchange between the equator and north polar regions.
Typically, CO2 is heavier than oxygen and nitrogen alone, so it tends to remain in the lower atmosphere. CO2 also traps heat and keeps it close to the earth. It does not matter if the heat comes from the earth, human activity, or from the sun, the end result is the same. This means that upper regions will chill as a result. The increasing amount and weight of greenhouse gasses and increasingly extreme temperatures by altitude work to create a widening energy gradient. If you have read other pages on this site you know that the greater the energy difference there is between extremes, the more violent is the exchange as these extremes move toward balance. Extreme cold above and extreme heat below cannot remain forever separated, so conditions are set for more violent exchanges. We know that in normal conditions, cold air sinks and hot air rises. You can set up an experiment to demonstrate this and it is done routinely with hot air balloons. We already know of record setting warmth, hurricanes, flooding, drought and the like for the decade of the 90’s and now for the new century. Interestingly, as warm areas get warmer, cold areas are getting colder. There are those strong lobby and pressure groups that deny all of this, but speak to the elders and relate to your own experience and you’ll find that something is definitely different about the current period. By projection, the greater the extremes become, the more violent will be the balancing, resulting in freak weather and the potential of the super-storm. When conditions are right, any phenomenon will be born. Recently, we witnessed the destruction of Hurricane Katrina in New Orleans in late Aug. early Sept. of 2005 and Hurricane Rita in Texas, Sept. 22 to 24. According to some, this was the worst disaster in almost a century, surpassed only by the 1908 San Francisco earthquake. Weather patterns were directly affected by Katrina all the way to Western Canada from the Gulf of Mexico. This almost made Katrina a super-storm. Pictures from space show a massive storm covering half the Gulf before it struck and wiped out New Orleans, destroying 160,000 homes and buildings, flooding 80 percent of the city and reportedly killing about 10,000. But it does not end there, according to weather monitors in Cuba, hurricane Gustav in 2008, reached wind speeds of 340 kilometres per hour, clearly placing it in the category six range and verging on seven, It has been called the worst storm in historical memory. As it did not hit the US, but went on to devastate Mexico, it was downplayed. However, Havana recovered faster from a category six than New Orleans from a category five hurricane. New Orleans is still under recovery, while repairs are almost complete in Havana. Cuba has a hurricane response plan in place so less people are injured and killed. Further, with a planned economy, building techniques are improved despite the enforced poverty from a 40 year plus blockade in place. Clearly, Cuba is doing is doing something right, whereas N. America apparently couldn't care less
One of the things Hurricane Katrina proved was just how thin the veneer of civilization is, especially in the US. During the flight from the disaster and the subsequent emergency follow up, it became clear just how real the color and class divide is. All the people left behind were black and/or poor. These folk took the brunt of the category 5 hurricane, many paying the ultimate price. After the storm, the whole region was reduced to stone-age conditions. There was no food, water and existing shelter battered into ruin. Even the big media acknowledged this. The people were left in a toxic flood of chemicals, excrement, oil and dead bodies. They took the brunt of post catastrophe disease such as cholera, dysentery, typhoid and other plagues. By comparison, after the much more severe Gustav, Cuba responded by evacuating millions, rebuild to better conditions and raised fast food plants like radishes and lettuce in the cities while the devastated agricultural recovered with slower growing plants.
There are natural and man-made greenhouse gasses and these drive the complexity of the great weather cycles including the contemporary one. Typical natural gases are methane and carbon dioxide. Into this mix for the current era, mankind adds additional carbon dioxide, methane, Halon, chlorofluorocarbons, exotic gases and the like. These tend to hold onto heat. Some tend to rise, but most hug the lower atmosphere. From natural sources, methane comes from organic processes and from a frozen reserve at the bottom of oceans under high pressure, more of which we have to comment later.
The Earth has experienced super-storms within recorded history. David Keys in his book “Catastrophe” refers to accounts after the 535 AD Krakatoa volcanic catastrophe that led to crazy weather and a hundred years of upheaval and effects that precipitated for several centuries thereafter. There are accounts of extreme cold, horrific winds, wild, exceptionally violent electrical storms, tornadoes in regions where they normally don’t occur and super sized hail. In one instance, super sized hail routed a siege and battle in what is now France, killing and injuring many of the unprotected siege participants. The planned battle never occurred on the very day planned as a result, for on that very day, a super-storm broke out pummeling the participants with killing hail. David Keys States on page 142 and 143;
“The bubonic plague pandemic which impacted so heavily on France in the sixth century had, of course, originally been triggered by climatic disruption of the wild-rodent ecology of east Africa in the 530s. But the world-wide 530s climatic problems had also affected French history more directly. For in 536 as climatic chaos racked the world, the bizarre behaviour of the weather actually succeeded in stopping a war and quite likely changing the course of French history.
It might seem at first like a somewhat fanciful story, but there are similar accounts of giant hail stones from around the same time, all associated with the 530s climatic downturn, in Britain and in China.”
For at that time, the Frankish world was divided into three kingdoms whose rulers - two brothers and a nephew - were literally at each other's throats. Childebert the King of Paris and Theudebert the King of Metz were about to attack Lothar, King of Soissons. It was through Lothar that the entire Frankish (Merovingian) dynasty continued to flourish after the mid sixth century, so his death in battle would probably have changed Frankish and therefore subsequent This altered French history for ever. There might well have been no Carolingians, no Charlemagne - and no medieval or modem state of France.
But that attack, though planned, never took place. Rain, or more accurately, giant hailstones stopped play! Once again, Gregory of Tours wrote down what happened:
'Childebert and Theudebert assembled an army and prepared to march against Lothar. When he heard of this, he realised that he was not strong enough to resist their combined forces.
'Lothar took to the woods, built a great circle of barricades among the trees, and put his trust in the mercy of God. Queen Clothilde [the mother of two of the kings] learned what had happened. She went to the tomb of Saint Martin [in Tours] where she knelt in supplication and spent the whole night praying that civil war might not break out.
'Childebert and Theudebert advanced with their troops, surrounded Lothar's position and made plans to kill him in the morning. When day dawned, a great storm blew up over the spot where they were encamped. Their tents were blown down. Their equipment was scattered and everything was overturned. There was thunder and lightning and they were bombarded with hailstones.
'They threw themselves on their faces on the ground, where the hail already lay thick, and they were severely lashed by the hailstones which continued to fall. They had no protection except their shields, and they were afraid that they would be struck by the lightning. Their horses were scattered far and wide. The two kings were cut about by the hailstones as they lay on the ground.
'They did penance to God and begged him to forgive them for having attacked their own kith and kin. None can doubt that this miracle was wrought by Saint Martin through the intercession of the Queen.'
Numerous written accounts from observers and historians around the planet in the sixth century describe super-storm type conditions with devastating results. So can it happen today? You bet! The conditions are ripe for climate related catastrophes that could effectively route current civilization.
Recent temperature changes shows some sudden spikes
There is information on a more recent volcanic explosion that created super cold weather and severe hurricanes. This was in 1816, after the April 10th explosion of Tambora. Accounts of those keeping logs of weather show a summer with snow and ice for Switzerland, Western Europe, Britain, the US and Eastern and Northern Canada. Ships logs show unusually violent wind and hurricane conditions in all the world’s oceans for the same year. Following years produced intense rain in some areas, droughts, famines and starvation in other areas on a global scale that extended up to 20 years. Some areas were impacted more severely than others. At the site of the explosion, a whole civilization was wiped out. The explosion had many of the characteristics of Vesuvius in 79 AD, only much hotter. This explosion was the most dramatic and violent since Krakatoa in 535 AD.
There is a recent case of huge hailstones that came from a “mega-storm” in Nebraska in June of 2003. The storm itself was intense for other reasons, generating a F0 tornado. Pictured at left are just two of the giant hailstones that were collected and photographed. A narrative of the event describes;… “on the evening of 22-23 June 2003 in south-central Nebraska during the BAMEX program. One cell (“the Aurora cell”) produced the largest recorded hail stone in U.S history. It fell at about 0005 UTC near Aurora, in Hamilton County, and measured 17.8 cm diameter and 47.6 cm circumference. During the first hour of this supercell’s life cycle, the percent positive reached nearly 50%, and then fell rapidly, where it remained. In the 5 minutes preceding the giant hailstone’s impact, only 5 of the 71 reported strokes were positive. Also, during this period, peak currents were unusually low for both polarities (12 kA for +CGs, and 9.1 kA for the –CGs). Another supercell ~100 km to the south (“the Superior cell”), contained the most intense mesocyclone ever recorded (Wakimoto, personal communication). This storm exhibited similar CG lightning characteristics, i.e., an initial burst of high +CGs percentages followed by strongly negative dominated CGs with both polarities showing very low mean peak currents.” This description, pictures and accounts of impact craters from giant hail certainly prove that this type of thing is possible and not a figment of imagination or the ranting of lunatics. I will add, it is not a punishment from God because of Disney World in Florida suggesting a “gay day” as charged by Pat Robertson. It is however, an act of nature, kicked into overdrive due to industrial green house gas additions to a changing and dynamic world weather system.
Giant hailstones are becoming increasiningly common
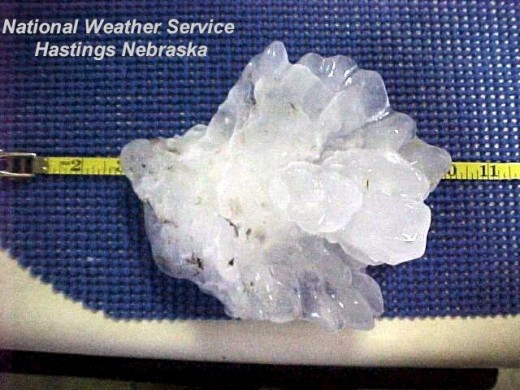
This hailstorm did a lot of damage as can be seen
Here is some contemporary proof of what David Keys describes in the 6th century historical accounts
Consider the recent Hurricanes, Andrew, Katrina, Rita and Gustav. These laid waste to the south eastern US, Cuba, Haiti and Mexico and literally turned civilization back to the stone-age locally. All the technological amenities taken for granted were brought to a complete standstill. People that stayed behind or were left due to their own wishes or as a result of poverty were reduced to primitive conditions in a flooded wasteland contaminated with all the products and waste of civilization. Katrina a hurricane of the late summer of 2005 that struck New Orleans, left more than a million homeless. It also ruined a lot of infrastructure and oil production facilities. Winds were stated as being 275 Km/h/175 m/h at times. This is some 40 MPH higher than terminal velocity, which means anything not nailed down became airborne! At this time, Europe suffered drought, fire storms and massive flooding in various regions. Even India suffered devastating flooding with a huge loss to crops and millions made homeless. All regions hit suffered homelessness, destruction of industry, agriculture and mass migration with its own catastrophes. Nay Sayers say things are not extreme but the weather since the 1990’s has gone from extreme to extreme, record event to record event.
Katrina from space when she was a category 5

The Frightful May 21st 2011 Tornado
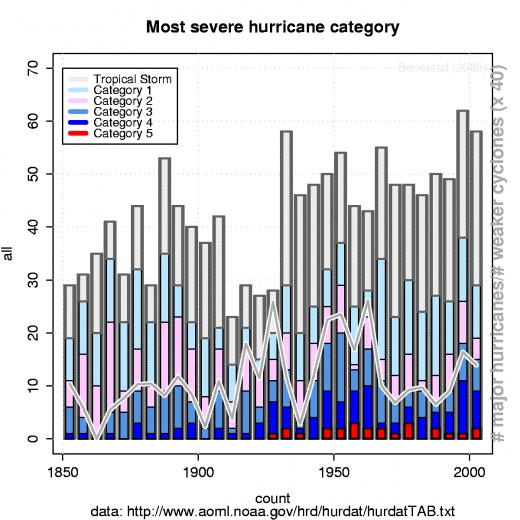
Consider the graph below for storm intensity. From about 1930 on up to the present, we see the emergence of category 5 storms. Even category 4 storms have increased markedly from the mid 19th century. Some will ague that this is merely a cycle and will pass. This is true insofar as nature left to its own. We can clearly see the large cycles in the ice cores and can detect an average 11 year cycle that matches the sun-spot cycle. The law of cycles holds when we consider how nature works. But, add human input by way of industrial activity and the pollutants that arise there from, we have something new that is added to the natural. Consider the graph below and left concerning hurricane wind speed and pressure. Since the 1850’s to the present, wind speeds have increased and pressure has dropped. Even with the devastation of Katrina and the highest number of hurricane activity for a single month (July 2005), the nay sayers will tell us to “wait and see.” We waited and we saw. We saw people abandoned to their fate after the storm was over. We saw the rich and middle class flee in their cars, leaving behind the poor and colored folk. We saw the class and race lines enforced and made plain. We saw destruction on a huge scale. We saw the helpless, sick and aged abandoned while caregivers ran for cover after refusing help. We saw martial law and the anarchy of civilization in route. We saw people shot by government forces for “looting” bottled water and food. We saw people looting TVs where there was no power to work them. We saw people wading waist and chest deep in chemical and sewage fouled flood waters. We saw cronyism run amok with the appointment of those who had not a clue about emergency operations. We saw too late, the hand wringing gestures of public relations apology while emergency efforts were bungled and operations dithered for the better part of a week. We saw tens of thousands housed like animals in factory farms, withering in 51 degree Celsius heat. We heard that the clean up team had to wear environmental protection gear because the stench in the dome was so intense, after the dome was empty for a week. We waited and this is what we saw. Does this mean we are now mending our ways and respecting nature? Take a look outside. It’s business as usual! The future storms will be worse. Katrina was called a mega-storm. I have a friend who went sky diving near Calgary Alberta. He reported a temperature inversion over Alberta the day Katrina made landfall in the Gulf. Instead of the usual -5 degrees, it was +15 degrees Celsius. The Katrina system organized weather over a vast expanse of the planet. Super-storms are even worse. We can expect more global disruptions from storms greater than category 5. We will have to define the category 6 and maybe even a 7 storm.
Storm intensity over the years
Following is a list of different categories of hurricane listed by wind strength. The first five are established with the low wind speed for four to five being the known boundary. The upper limit for a five and lower for six, is an estimate, accurate within a few Mph or Km/hr. The upper limit for the category six is not as certain and requires more research. No one has ever recorded a category six hurricane, but I believe it is just around the corner based on other changes in the atmosphere detailed above and in the seas.
Category One Hurricane: Winds 74-95 mph (119-153 km/hr).
Category Two Hurricane: Winds 96-110 mph (154-177 km/hr).
Category Three Hurricane: Winds 111-130 mph (178-209 km/hr).
Category Four Hurricane: Winds 131-155 mph (210-249 km/hr).
Category Five Hurricane: Winds 155-185 mph (249-290 km/hr).
Category Six Hurricane: Winds greater than 185 mph (290 km/hr).
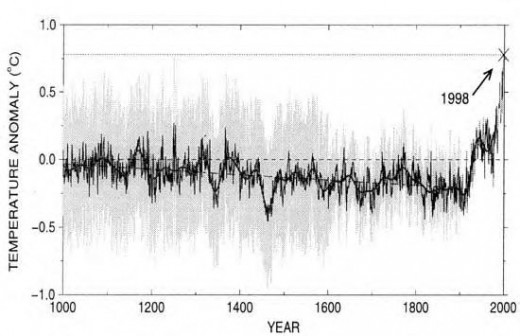
We can actually project the emergence of category 6 and 7 storms based on what has evolved thus far. Category 4 storms have sustained wind speeds of 210 Km/hr or more and category 5 storms at 250 Km/hr or greater. By projection we can say that a category 6 storm would have sustained wind speeds of 290 Km/hr and category 7 storms speeds of 330 Km/hr. How likely are such monsters to be born? All it takes is an increased temperature gradient between warm seas and colder stratospheric temperatures. This difference is still accumulating due to our addition and acceleration of adding of greenhouse gasses to the atmosphere. Based on what we have seen up to now, it is quite possible to see the emergence of a category 6 storm by the 2008 hurricane season. In any event, the next expected solar maximum of 2011-2012 should provide the impetus to generate such a monster. In the hurricane season of 2012, the monster "perfect storm" Sandy hit New York and had wind speeds and a storm surge that would easily place it in the Category six class. The former was added post 2012 and is something of a prophetic fulfilment. A category six strom would make Katrina look like a minor glitch in comparison. Consider the graph below that shows a general temperature cooling from 1000 AD to about 1900, where a sudden reversal began. From then on, there has been a radical global temperature rise. The difference between averages for 1900 and 1998 is almost 1 degree Celsius.
Temperature changes over the last thousand years
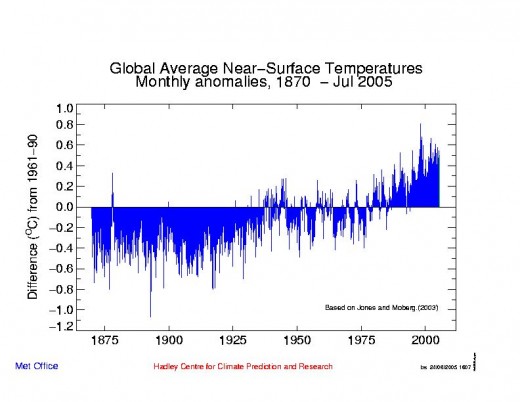
The graph below indicates temperature anomalies month by month from 1870 to July 2005. There is a spike during 1880. From abut 1933, the frequency of warmer months begins and increases in intensity and frequency.
The climate tends to work partly in lock-step with the solar cycle as seen in the solar/weather comparison al left. This is in addition to other influences such as volcanoes and human activity. During sun spot maximum periods, the temperatures on earth increase and the atmosphere expands. During this time, oceanic evaporation increases. In general, maxima periods tend to be dryer than usual. When the solar cycle begins toward minima, temperatures fall and the water-logged atmosphere releases torrents of rain. It is during the decline to minima that a lot of heat exchange takes place and great storms are born as the atmosphere seeks to balance temperature extremes. The human factor must be added to this. What the extent of the next maximum will be remains to be seen. Predictions in this area can only be generalized at this point. However, we can be reasonably certain of maximum solar activity on or about 2011-2012 given the average trend.
In recent history, we have been lulled into a false sense of apparently benign climatological security. There have been periods where the weather extremes rivaled conditions on other planets. Weather conditions on other planets tell us what is possible. Venus suffers a run away greenhouse effect. Mars has periodic global encompassing dust storms, obscuring the sun several months at a stretch. Even cold Titan boasts a weather cycle, but at extremely cold conditions. Neptune boasts winds that typically blow at 1,200 Km/h.
Venus also boasts a permanent cloud cover with high winds. The surface temperature is about 800 degrees Fahrenheit. The surface pressure is more like that of water pressure at a substantial depth on Earth. But, there is not even a hint of water there. The atmospheric heat distorts light so severely, that any sunlight reaching the surface, curves right around to the night side, creating bizarre mirage conditions.
Mars’ thin atmosphere on the other hand, also mostly CO2 has frequent high winds and dust devils over the entire range of the planet. The dust devils literally carve features on the surface. Global dust storms demonstrate the global character of Martian weather. These are of great concern for future explorations. Those colonists living on the surface will have to put up with several month long storms. Experiments on Earth tell us the all electronics are quickly rendered useless after being shorted out by intense dust storm activity. Not only that, the dust and sand driven at 200 M/Hr and more, sandblasts anything in the way.
Sources of methane, carbon dioxide on Earth range from biological activity, volcanism from reserves frozen in the oceanic depths to human industrial activity. Research has shown that volcanic explosions can alter the planetary climate in two ways. One is by obscuring the sun, such as what happened when Krakatoa blew up in 535 and 1883. The dust tends to cause a radical temperature drop in short order. The other is by venting huge quantities of carbon dioxide and causing warming with a run away green house effect. Such an event occurred 400 million years ago during the ice-ball period of Earth’s geological history. The sudden release of CO2 caused a global melt-down and gave birth to a long standing global super-storm that rained acid on a continual basis for a time span that is beyond what any of can appreciate. Methane when released into the atmosphere has only short term effects. This effect is clear in the ice cores. Ultra violet radiation breaks it down readily and leaves behind a tarry resin that settles back to Earth Methane is one source of oil that accumulated over eons. CO2 on the other hand is far more persistent. The super-storm is triggered resulting in immediate extreme climate change if the cause is natural. This can have as its cause, super volcanic explosions, impacts from massive bolides (1 km or more in diameter) and more subtly from accumulated man-made input. The last trigger is a cumulative effect, so we do not notice the super-storm creeping up on us. We take a “wait and see” attitude because the change here is more gradual instead of catastrophic. Yet, when the category 6 and 7 storms do come, the result will be catastrophic! If recent events with category 5 storms can be taken at face value, then we are in serious trouble!
If nature abused is not bad enough, our penchant for doing one another harm in warefare adds to the insult. There is a substantial black budget in the USDOD that is used to run all sorts of arcane and secret experiments including upon the weather. One of these experiments is something called H.A.A.R.P. (Harmonic Active Aurora Resonance Program). It’s main purpose is to cause atmospheric expansion by super-heating it. This is conceived as a method to block incoming ICBMs (Intercontinental Ballistic Missiles). Alternatively, atmospheric expansion can be used to deflect the jet stream and cause drought and/or flooding in remote areas from the source of the action. This is done to eliminate the enemy’s food supply and to reduce them to the level of the stone-age. It would be a cake walk thereafter to invade the territory and take over. Weather wars are now a real possibility and can bring the triggering of doomsday to target populations by selective atmospheric expansion.
The role of the solar cycles in nature is to act on the whole of the Earth’s dynamical system. This includes the weather. There are several solar cycles, which have remained more or less constant through the millennia, These include the 11, 22, 179, 500 and 1,500 year cycles, which function in concert and independently. There have been periods where the sun has been “cool” for hundreds of years, causing mini ice ages on Earth such as the well known Maunder and Spoorer minima. During these eras, agriculture fell off, famine prevailed and diseases like bubonic plague ravaged the world. These cycles are ongoing and catastrophic changes will occur again. It is not a question of if, but when. Judging from the recent past with Katrina, we will not be ready!
Due to our input and insult to nature over the greed for ever greater wealth, we now stand at the edge of a yawning chasm. Natural vagaries notwithstanding, our own input can exacerbate an already catastrophic occurrence. This means that natural cataclysms can be magnified as a result of our actions. We can elect to change our ways and develop ways of doing things that until now have been suppressed. But again, if history serves as an indicator, this is not to be as it would seriously harm business and profit making as it is now done. So, we walk inexorably to a predestined fate because of unwillingness to change the way we run civilization. Civilization contains within itself, the seed of barbarism. We have sown to the wind and now we stand ready to reap the whirlwind, called the global super-storm. God (nature) forbid that a super volcano explodes, or a sizable asteroid smacks the Earth or a mega-earthquake strikes at the same time!
Earth's surface temperatures since 1870