G-Force Tolerance
When different forces are applied to an object, the term which is used to describe the resulting acceleration is called “G-force”. Because of the fact that humans have greater tolerance to forward acceleration than backward acceleration we have different set of tables for each of them. In our first part of task we got the table that illustrates the tolerance of human beings to horizontal G-Force.

In this table we can see that there are two different variables. One variable is time which is measured in minutes and another variable is G-force which is measured in g-“gees”. Because this data has its measurements minutes and gees we can tell that none of these can be negative.
For later on plotting of the graph I will use Time on X axis and G-force on the Y axis. Time is commonly used on X axis because time is independent in most of the time. Because time cannot be negative, in future graph there would be no Y intercepts. Concerning accuracy of graph, it will probably lose its accuracy as going to infinity.
Next thing I had to do is to plot the data points on the graph so I did it. That looks like this:
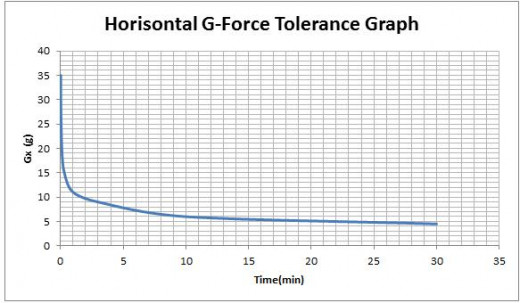
I plotted this graph using MS Excel and it is showing the amount of G-force (g) applied on human body over a period of time (min). This graph is obviously decreasing and never intercept x or y axis because time and G-force can’t be negative. G-force can be 0 but in that case time is infinity.
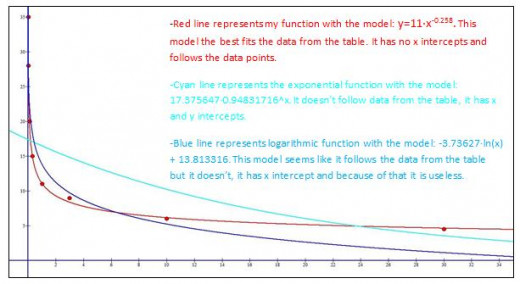
Because I wasn’t sure what function it is, logarithmic or power, next thing I have done is checked what type of function is this. I have done that in excel by using those regression types. That looked like this:
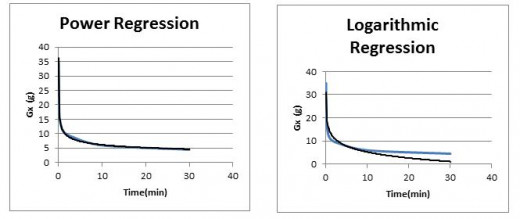
As we can see this graph mostly is same as power function so I treated it like that.
Next thing I have done is to find function model which is fitting my graph.
Basic formula for power function is Y=a · xb. So by using my coordinates which I taken from the table which is given on the beginning I calculated my constants a and b. Calculation process looks like this:
From table I used (x, y)=(1, 11) so I putted it in my formula and I got that 11=a · 1b and because we know that one (1) on the power of any number is 1 I got this: 11=a · 1 => a=11. Next thing I have done is that I used another coordinates from table to calculate b and calculation looks like this:
I used coordinates (x, y) = (0.3, 15) => 15= 11* 0.3b => 0.3b = 15/11 => all multiplied by log =>log 0.3b= log 15/11 => b log 0.3 = 0.135 => b · (-0.523) = 0.135 => b = -0,258 so by calculating logarithm from this number I got that b = - 0, 258. So my final model for this graph is: Y = 11 · x- 0, 258.
After finding my model I compared it with model of regression which I made using technology (Excel in my case). Using technology I found model of regression and it states like this: Y = 11,087 · x- 0, 257 and comparing with my model it is very similar. My model is bit different than the one got by the technology because regression graph is not completely same as my graph.
So next thing I need to do is to test the model:
y=11·0.01-0.258 => y= 11·3.28 => Y=36 (Table result is 35, this is nearly true);
y=11·0.03-0.258 => y= 11·2.47 => Y=27 (Table result is 28, this is nearly true 28);
y=11·0.1-0.258 => y= 11·1.81 => Y=19.9 (Table result is 20, this is nearly true);
y=11·0.3-0.258 => y= 11·1.36 => Y=15 (Exact solution, Table result is 15);
y=11·1-0.258 => y= 11·1 => Y=11 (Exact solution, Table result is 11);
y=11·3-0.258 => y= 11·0.75 => Y=8.2 (Table result is 9, this is nearly true);
y=11·10-0.258 => y= 11·0.55 => Y=6 (Exact solution, Table result is 6);
y=11·30-0.258 => y= 11·0.41 => Y=4.5 (Table result is 4.5, this is nearly true).
As we can see from this testing of my model the results are near to or same as the results in the table. That can be because I used near solutions of my calculations in the process of calculation of the function model.
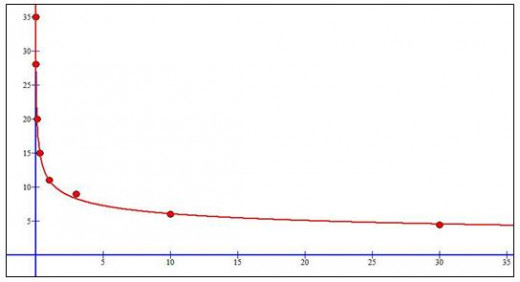
Next thing to do is to draw your model function and the original data points on a new set of axes, that looks like this:
For next part of our portfolio I need to find another function that models the data and on the new set of axis draw my function model and model which I found using technology.
In previous picture you can see that my model (y=11·x-0.258) almost perfectly fits the original data points and this graph shows us that as G-force is higher the time that human beings can tolerate it is lower. That gives us the information that x and y axis will never be intercepted but there is possibility for graph to touch axis when g=0 but in that case time will be infinity.
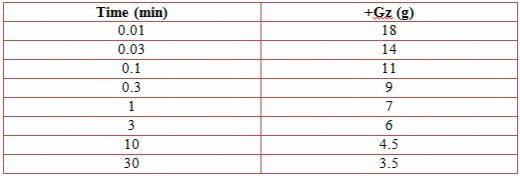
Next part of our task is about vertical G-Force tolerance applied on human bodies. For that part we got new table with data. The notation “+Gz” represents a positive acceleration in the vertical direction i.e. blood towards feet.
My previous model on new set of point looks like this:
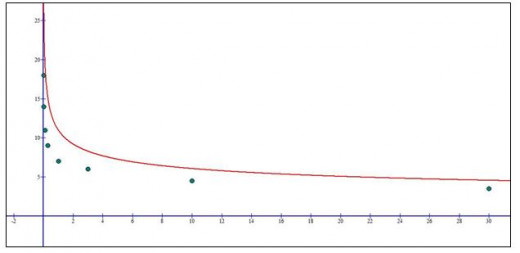
Looking at the graph you can conclude that my old model doesn’t fit new data, that is mainly because the human body doesn’t tolerate vertical G-force and horizontal G-force at the same quantity.
So, to get my model fitting this type of data I need to do some changes. I can’t do that just by looking at the graph, I need to calculate new model so my hypothesis is that I would need to decrease constant a and increase constant b because graph looks lower steeper. To prove my hypothesis I need to get new model.
To get the model for the new set of data we need to calculate it again. Calculation process looks like this:
Basic formula for power function is Y=a · xb.So by using my coordinates which I taken from the table which is given on the beginning I calculated my constants a and b. Calculation process looks like this:
From table I used (x, y)=(1, 7) so I putted it in my formula and I got that 7=a · 1b and because we know that one (1) on the power of any number is 1 I got this: 7=a · 1 => a=7. Next thing I have done is that I used another coordinates from table to calculate b and calculation looks like this:
I used coordinates (x, y) = (10, 4.5) => 4.5= 11* 10b => 10b = 4.5/7 => all multiplied by log => log 10b = log 4.5/7 => b log 10= -0.192 => b = -0.192 so by calculating logarithm from this number I got that b = - 0.192. So my final model for this graph is: Y = 7 · x- 0.192.
As my hypothesis states constants a decreased and constant b increased. The first model looks like this: Y = 11· x- 0, 258 and the second one:Y = 7 · x- 0.192. When I apply this model to new set of data graph looks like this:
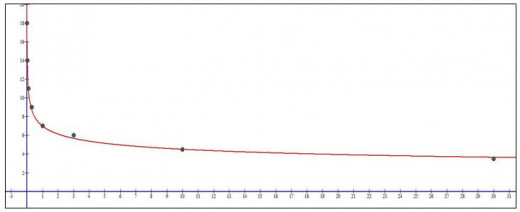
This graph almost perfectly fits the new data and that is proving that this model is good.
The final part of my task is to discuss any limitation of my model the implications of your model in terms of G-forces acting on a human being. Limitations of this models and graphs are that neither time (x) or G-force (y) can be negative. The G-force can be 0 but in that case time will be infinity. That is why graphs are approaching to x and y axis but never intercept them. One more limitation is when the G-force is higher than 50 we can say that time is very low, very close to 0.


