Sample Master's Thesis - Chapter 3: Implemetation Strategy
Published: January 20, 2012
Revised: January 23, 2012
No plan is complete without a strategy for completion or a road map of the steps to take. The implementation strategy for the IT Virtual Lab Project includes a project plan, risk management plan, and cost benefit analysis. These components of the project plan are detailed in the following sections.
Project Plan
Integrating the project within the college will require certain technical resources including people. The required people for the implementation will include the other IT instructors, the Program Chair Person, and the Network Administrator. Other stakeholders include the Director of Education, the College President, and the affected students.
The necessary technical resources include the space for the lab, 24 PCs, 4 file servers to control the environment and provide services to the students, miscellaneous wiring, two routers, two 12-port switches, a firewall, and a connection to the Internet on the outside interface of the college production firewall.

computers meet the requirements to host the Linux operating system so three of them will be used as Linux servers. These Linux servers will then take on various roles within the lab, including routing and firewall services. The remaining file server and PCs must be procured. A connection to the Internet may be simulated to reduce the possibility of risk to the production network. The network administrator expressed the concern that providing a connection to the Internet may defeat one of the purposes for the lab (personal communication with network administrator, February, 2010).
Risk Management
Risk management may be considered the very purpose for this project and entails performing a risk analysis to determine the probability of a risk occurrence, the effect of the occurrence should the risk manifest, actions to take, and mitigation strategies; if any. The first component of risk analysis is to identify the risks. The risks that Dayton College faces that brought about the proposal for the Virtual IT Lab have been identified as follows:
- Compromise of the production network
- Compromise of HIPAA or Student related information
- Loss of accreditation
- Loss of financial aid
- Theft
- Malware infection
- Sexual harassment
Tasks and Schedule
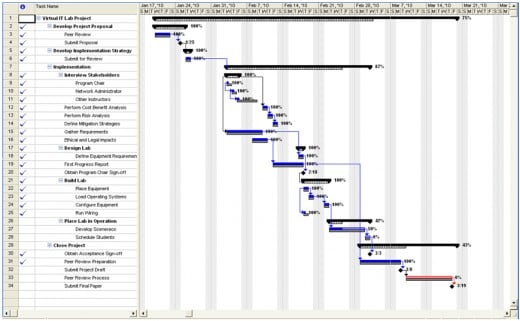
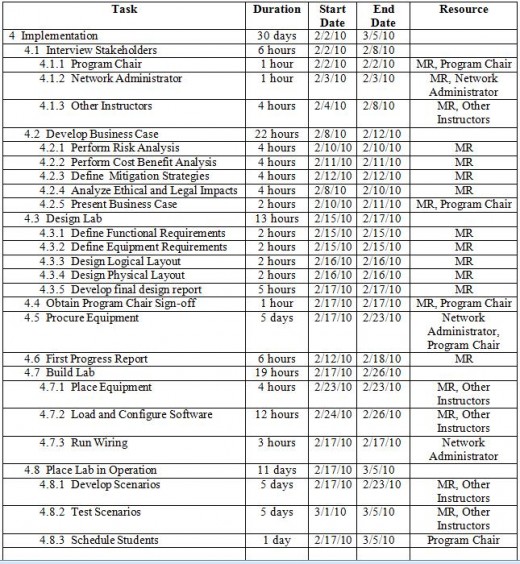
The schedule for the successful completion of this project has been developed and is illustrated in the Gantt chart identified as Figure 1: Virtual IT Lab Project Gantt Chart; which follows this section. Further clarification of the timeline is contained in Table 1: Virtual IT Lab.
Project Schedule
Milestones for the project comprise tasks with short durations and include submitting the project proposal, obtaining sign-off from the program chair, submitting the project draft, and the final project submission. The first milestone was completed with the formal submission of the project proposal. Sign-off from the program chair was bypassed in the form of a mandate issued by the Director of Education to proceed with the project.
Qualitative Analysis
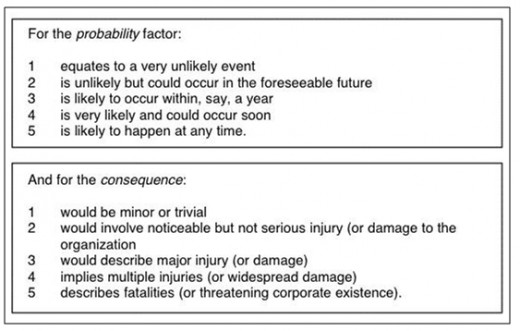
The next step of risk analysis is to predict the probability of the risk occurrences and the affects of those occurrences. A qualitative analysis was performed on the risks to predict the probabilities and consequences. Each risk was assigned a probability factor from 1 to 5 with 1 being highly unlikely and 5 being highly likely. Each risk was assigned a consequence factor also in the range from 1 to 5 with 1 relating to a trivial consequence and 5 relating to a fatal occurrence. A risk score is then determined by using the following formula as prescribed by Broadstairs (2000):
Risk Score = Probability x Consequence
This qualitative method is summarized by Table 2: Risk Probability and Consequence; which immediately follows:
Risks were added to the Risk Matrix as they were identified; see Table 3: Virtual IT Lab Risk Matrix; which immediately follows:
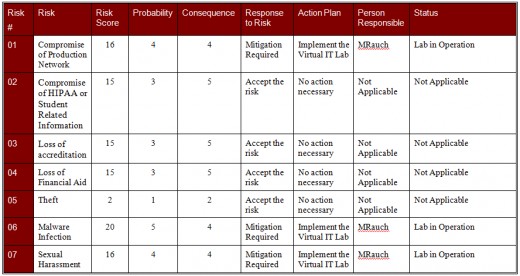
Once a risk was added to the Risk Matrix, the probability and consequence was determined using the above method by the stakeholders in a cooperative brainstorming session. The risk score was calculated by multiplying the values in the risk matrix and the risk scores were then used to identify the major risks. Any risk with a risk score greater than 15 was identified as a major risk requiring mitigation. Three risks surfaced as major risks and these include: malware infection, sexual harassment, and the compromise of the production network. Although the loss of accreditation, loss of financial aid, and the compromise of HIPAA or student related information scored high in the consequence factor, the risk score of those risks was just low enough for them to be deemed acceptable at this time because they should be mitigated by actions taken in response to the identified major risks.
Quantitative Analysis
One quantitative method of risk analysis is to perform an Annualized Loss Expectancy (ALE) which, according to Rainer, Snyder, & Carr (1991), first lists the IT assets of an organization then analyzes the potential threats to those assets and the resulting loss to the organization that would occur if those threats were to manifest as incidents. These vulnerabilities to threats are expressed as a probability of occurrence over the term of a year. As reported by Rainer, Snyder, & Carr (1991), the expected loss per year from a particular threat/vulnerability pair is determined by multiplying the probability of occurrence per year by the expected loss. Summing all the expected losses yields the total risk and is reasonably assumed to be the amount that management should expect to spend on security and countermeasures.
Performing a quantitative analysis on the loss of accreditation would be difficult if not impossible to accomplish. However, the ALE of malware infection may be approximated. The standard method to clean an infected PC is to re-image the contents of the hard disk drive. This procedure occupies about two hours of the network administrator’s time; note: the network administrator is paid at the rate of $30 per hour. At the rate of five infections per month of the colleges 425 computers (personal communication with the network administrator, January 2010) the network administrator spends about 10 hours per month re-imaging hard drives. This leads to ALE of $600 per month or $7200 per year, adjusted for overtime.
Identifying and quantifying risks as part of the risk analysis leads the organization to determine the risks that must be managed and those that may be lived with. A method of action is necessary to deal with those managed threats that manifest as incidents. An incident response plan lays out those steps that will take place in event that an incident occurs.
The current incident response procedures entail notification chains that are dependent upon the type and severity of the incident. This procedure is detailed in Appendix A: Dayton College Incident Response Procedure and would be sufficient for the Virtual IT Lab environment.
Incident Reporting
Incident reporting is currently contained as part of the incident response procedure and involves opening a trouble ticket with the help desk and detailing the problem. The resolution process is documented but no tracking or analysis mechanisms are currently in place. Incidents in the Virtual IT Lab environment would be of lesser priority than those in the production environment and will require no special reporting requirements. However, deficiencies in the current incident reporting process are covered in the recommendations section of the final chapter of this paper.
Risk review should be an ongoing process to define new risks and evaluate the effectiveness of existing controls and countermeasures. The risk review process can be a formal activity or an informal one. In the case of the Virtual IT Lab Implementation Project, the risk review process will be an informal one that will take place at the bi-weekly staff meetings of the instructors who maintain the lab; review members will include the IT instructors and the program chair.
During the risk review, the risk matrix will be analyzed and the individual risks contained within will be evaluated to determine if the risks are still relevant and if so, whether the mitigation strategies are effective. Any occurrences that have surfaced since the last review will be analyzed to determine if they indicate new risks and if so they will be added to the risk matrix and quantified to determine if mitigation is in order.
Cost Benefit Analysis
“Cost benefit analysis involves identifying costs and benefits for each alternative investment, discounting the costs and benefits back to the present, and selecting the best alternative according to a pre-specified criterion” (Schniederjans, 2004).
Table 4: Possible Costs of an IT Investment illustrates the different types of costs that may be experienced as part of an IT project. Some of these costs apply to the Virtual IT Lab project and some do not. The applicable costs were input into the resource tracking component of Microsoft Project to develop a schedule of costs for the project plan.
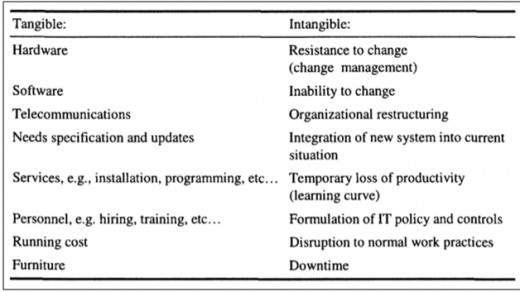
Table 5: Virtual Project Lab Costs Schedule provides a breakdown of the specific costs associated with the Virtual IT Lab project. To complete the cost benefit analysis the costs of the project were compared to the benefit. A quantifiable risk exposure of the college is that of virus infections in the various labs. Incidents arising from this risk exposure account for approximately $7600 per year as identified in the Quantitative Analysis section above.
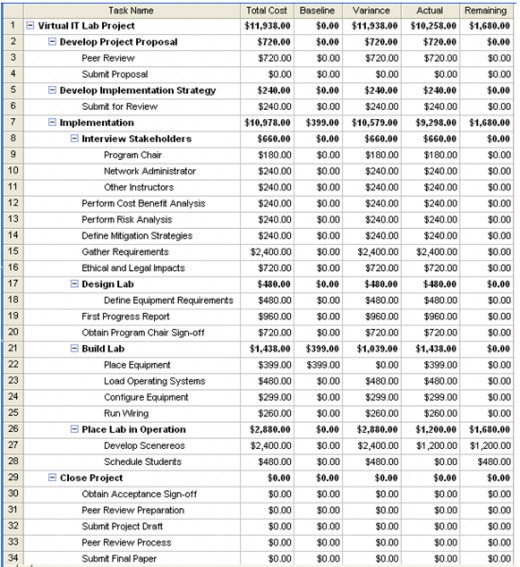
The warranty period, or expected lifetime of a new PC is three years. The cost of viral infections over the lifetime of the PCs is determined by multiplying the cost of the viral infections by three; which yields a figure of $22,800. A savings or loss is determined by subtracting the cost of the project, $11,938 from the $22,800 figure; which results in a savings of $10,862 over the three year period or about $3621 per year. Therefore, the cost benefit analysis demonstrates that the project will save the college $3621 per year. This is not a monumental figure but the savings demonstrate a gain to the college rather than a loss. Combined with the implications of the other risks, the cost benefit analysis indicates that the project should continue to implementation.
Navigate the Thesis
Review Chapter 2: Information Security Governance and Practices
Continue to Chapter 4: Project Completion and Recommendations
References
Accrediting Commission of Career Schools and Colleges. (2010). The Accreditation Process.Available from http://www.accsc.org
Broadstairs, K. (2000). 01-2-2 Quantifying Risk. In K. Broadstairs, R. King, & D. O'Conor (Eds.), Risk Management (p. 39). GBR: Scitech Educational.
Dragoon, A. (2003). Governance: Deciding factors. CIO. Retrieved February 18, 2010 from http://www.cio.com/article/29619/Governance_Deciding_Factors?page=1
Eckert, J. W., & Schitka, M. J. (2006). The hacker culture. Linux+ Guide to Linux Certification (2nd Ed.) (pp. 17-18). Boston, MA: Course Technology
GAO. (1998). Executive guide: Information security management--learning from leading organizations: AIMD-98-68. GAO Reports, 1., Government Accounting Office
Georgia Institute of Technoloogy. (2008). Emerging cyber threats for 2009. CU360 , 34 (21), 4-5.
ISO 17799 Portol. (2007). What is ISO 17799? Available from http://17799.denialinfo.com/index.htm
Moteff, J. (2004). Computer Security: A Summary of Selected Federal Laws, ExecutiveOrders,and Presidential Directives. Library of Congress, Congressional Research Service
Panel on Confidentiality Issues Arising from the Integration of Remotely Sensed and SelfIdentifying, & National Research Council. (2007). Putting people on the map: Protecting Confidentiality with linked social-spatial data. Washington, DC: National Academies Press.
Rainer, R., Snyder, C., & Carr, H. (1991). Risk Analysis for information technology. Journal of Management Information Systems , 8 (1), 134-135.
Schiller, C. (2007). Botnets. Network and Systems Professionals Association. Available from http://www.naspa.com/
Schniederjans, ,. M. (2004). Information Technology: Decision-Making Methodology (p. 140).Singapore: World Scientific Publishing Company.
Spammer-X. (2004). Inside the SPAM Cartel: Trade Secrets from the Dark Side. Rockland, MA: Syngress Publishing
Treviano, L. K., & Weaver, G. R. (2003). Managing Ethics in Organizations : A Social ScientificPerspective on Business Ethics. Palo Alto, CA: Stanford University Press.
U.S. Senate. (2009). Safe Internet act: S 1047 IS. Library of Congress.


