Variable Associations and Correlation Coefficients


What are the different types of associations found among variables? What tools can be used to display these relationships?
Correlation is the “association between scores on two variables” (Aron, Coups, & Aron, 2013, p. 440). There are five main types of correlation among variables; linear correlation, curvilinear correlation, positive correlation, negative correlation, and no correlation. Linear correlation is the relationship between two variables this association shows up when the dots on a scatter plot roughly follows a straight line. Curvilinear correlation is the association between two variables that can be seen on a scatter diagram however unlike linear correlation this correlation does not follow a straight line, but instead follows a systematic pattern. Positive correlation is an association where when the amount of one variable increases, the amount of a second variable also increases (About Education, 2014). Negative Correlation is the almost opposite of positive correlation; high scores go with low scores, mediums with mediums, and lows with highs. Negative correlation appears on a scatter diagram when the dots do follow a straight line, but the line slopes down and to the right. The last type of correlation is no correlation this happens when there is “no systematic relationship between two variables” (Aron, Coups, & Aron, 2013, p. 446). The best tool to show the different types of associations found among variables is the graphical representation know as a scatter diagram or a scatter plot.
Reference
Aron, A., Aron. E., Coups. E. (2014). Statistics for Psychology Pearson Education Inc. 2014.
Introduction to Research Methods. (2014). In About Education. Retrieved from
http://psychology.about.com/od/researchmethods/ss/expdesintro_5.htm
What are the four types of correlation coefficients? After reviewing quantitative research, how can the correlation coefficients be used to draw conclusions about the relationship of the data?
A correlation coefficient is the “measure of degree of linear correlation between two variables ranging from -1 (a perfect negative linear correlation) through 0 (no correlation) to +1 (a perfect positive correlation)” (Aron, Coups, & Aron, 2014, p. 453). There are four main types of correlation coefficients they are: Pearson’s product-moment correlation, Spearman rank-order correlation, point-biserial correlation coefficient, and the phi coefficient.
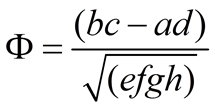
Pearson’s product-moment correlation (r), also known as the Pearson correlation coefficient, is a measurement of the degree of a linear relationship between two variables, typically labeled X and Y (Stockburger, 2014). Spearman rank-order correlation (, also signified by rs) is based on rank-order scores and is less affected by outliners; it is normally used in situations where the scatter diagram shows a curvilinear relationship between two variables (Aron, Coups, & Aron, 2014, p. 476). A point-biserial coefficient (rpb) relates observed item responses to a total scores; it is specifically used when one set of the data is dichotomous in nature (Measured Progress, 2014). The phi coefficient is a measure of the degree of association between two binary variables. This measure is similar to the correlation coefficient in its interpretation. The phi coefficient is a measure of the degree of correlation between two binary variables; the interpretation is similar to the correlation coefficient (Pmean, 2014). The formula for the phi coefficient is .
Correlation coefficients are commonly used to draw conclusions about the relationship of the data. The correlation coefficient can be used to determine if the data that results from quantitative research is statistically significant. When the data is not statistically significant it means that the data occurred from chance alone and the results cannot be consistently replicated. To test the statistical relationship of the data the correlation coefficient is used in a hypothesis test. The formula for this hypothesis test is H0: p=0 HA: p≠0 ; H0 is rejected if T≥ tα/2, n-2 or if T≤ -tα/2,n-2. If the null hypothesis is rejected then the conclusion is that correlation coefficient is not equal to zero and that there is statistically significant linear correlation between the two variables. However if the null hypothesis is not reject then the conclusion is that the correlation coefficient is equal to zero and that either there is no linear relationship between variables.
References
Aron, A., Aron. E., Coups. E. (2014). Statistics for Psychology Pearson Education Inc. 2014.
Correlation Coefficients. (n.d.). AEA 267 Assessment. Retrieved October 10, 2014, from https://www.aea267.k12.ia.us/assessment/statistics/descriptive-statistics/correlation/correlation-coefficients/
Discovering the Point Biserial. (n.d.). Measured Progress. Retrieved October 10, 2014, from http://www.measuredprogress.org/learning-tools-statistical-analysis-the-point-biserial
Spearman's Rank-Order Correlation. (n.d.). Laerd Statistics. Retrieved October 10, 2014, from https://statistics.laerd.com/statistical-guides/spearmans-rank-order-correlation-statistical-guide.php
Stockburger, D. (n.d.). Correlation . Introductory Statistics: Concepts, Models, and Applications . Retrieved October 10, 2014, from http://www.psychstat.missouristate.edu/introbook/sbk17.htm
Chapter 11: Correlation
Correlation
Association between scores on two variables
e.g., age and coordination skills in children, price and quality
Graphing Correlations
The Scatter Diagram
Steps for making a scatter diagram
1. Draw axes and assign variables to them
2. Determine range of values for each variable and mark on axes
3. Mark a dot for each person’s pair of scores
Graphing Correlations
The Scatter Diagram
Graphing Correlations: The Scatter Diagram
Patterns of Correlation
Linear correlation
Curvilinear correlation
No correlation
Positive correlation
Negative correlation
Degree of Linear Correlation
The Correlation Coefficient
Figure correlation using Z scores
Cross-product of Z scores
Multiply Z score on one variable by Z score on the other variable
Correlation coefficient
Average of the cross-products of Z scores
Degree of Linear Correlation
The Correlation Coefficient
General formula for the correlation coefficient:
Positive perfect correlation: r = +1
No correlation: r = 0
Negative perfect correlation: r = –1
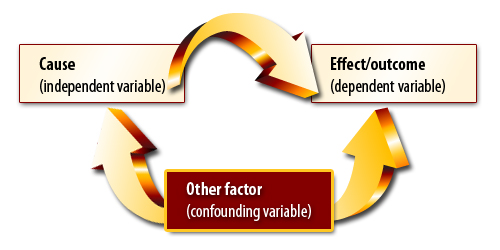
Correlation and Causality
Three possible directions of causality:
1. X Y
2. X Y
3. Z
X Y
Correlation and Causality
Correlational research design
Correlation as a statistical procedure
Correlation as a research design
Issues in Interpreting the Correlation Coefficient
Statistical significance
Proportionate reduction in error
r2
Used to compare correlations
Restriction in range
Unreliability of measurement
Curvilinearity
Spearman’s rho
Power for Studies Using
Correlation Coefficient
(.05 significance level)
Table indicated below here
Approximate Sample Size for
80% Power for Correlation Studies (.05 significance level)
Table indicated below here
Correlation in Research Articles
Scatter diagrams occasionally shown
Correlation matrix