- HubPages»
- Technology»
- Computers & Software»
- Computer How-Tos & Tutorials
Excel 2002/2003 vs. 2007 Part 3: New Enhancements in Excel 2007

What's New in Excel 2007?
Like the other Office 2007 applications, Excel 2007 takes a little more to get used to as opposed to the mild changes in earlier versions of Excel. In previous hub articles, you learned about the new ribbon bar and how to get Toolbar help in Excel 2007, as well as how to handle file incompatibility. Now let’s take a look at some of top enhancements in Excel 2007.
New Cell Styles
Excel 2007 offers some new cell styles. This can help you make your spreadsheet more attractive and professional looking and keep your formatting consistent with regards to design and layout. Give it a try. Here’s how.
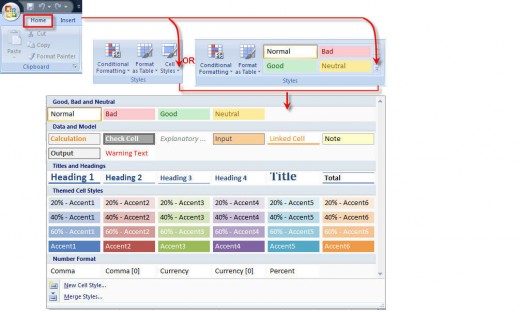
- Select one or more cells where you wish to experiment with different styles. To select adjacent cells, just drag your mouse across several cells. To select non-adjacent cells, click in the first cell, then use CTRL+click to select additional cells.Make sure the Home tab is selected (see Figure 1. below).
- From the Styles group, click on the drop-down arrow next to the Cell Styles button. If you don’t see the Cell Style button, then click on the More button next to colored cell styles box. (see Figure 1. below).
- A variety of cell styles will appear. Just mouse over the different
styles and you will be able to see the your cells in that style. Then just click
the cell style to apply. If you don’t like the one you select, while your cells
are still selected, experiment until you find the one you like.
Figure 1. Cell Styles
Build Bigger Worksheets
Did you know that in older versions of Excel, you could build worksheets up to 65,536 rows by 256 columns? In case that wasn’t enough, in Excel 2007, you can build a worksheet as big as 1,048,576 rows and 16,384 columns.
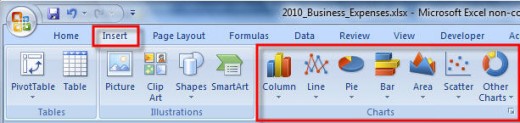
Chart types in Excel 2007 are the same (Columns, Bar, Line, Pie, etc.):
Figure 2: Chart Types
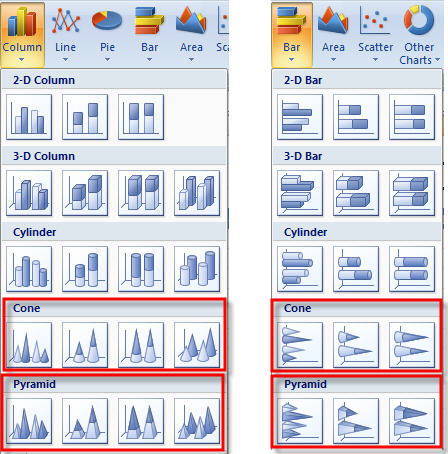
However, there have been a few more varieties of charts added. Some chart types, like column and bar charts, now have cone and pyramid shapes:
Figure 3: New Cone and Pyramid Styles
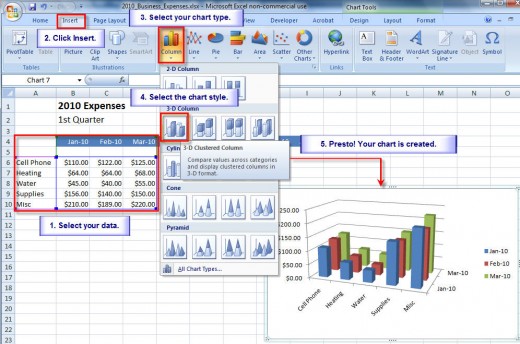
Creating Your Chart
Let's review how to create a chart (see Figure 4 below for visual steps):
- Select your data.
- Click Insert.
- Select you chart type.
- Select the chart style.
- Your chart is created.
Figure 4: Creating a Chart
Was this article helpful?
© 2010 Amelia Griggs
Related

User Interface design using a UserForm in Excel 2007 and Excel 2010

Using the Analysis ToolPak in Excel 2007 and Excel 2010

Using the COUNTIF and COUNTIFS functions and Remove Duplicates in Excel 2007 and Excel 2010

How to create and configure a bubble chart template in Excel 2007 and Excel 2010

How to use the Excel 2007 and Excel 2010 Solver Tool in a spreadsheet for solving problems and optimization
![How to Remove Kaspersky Password Protection? [Easily Recover]](https://images.saymedia-content.com/.image/t_share/MTc2Mjk3NDcwOTAzNTkyMTI2/how-to-remove-kaspersky-password-protected-easily-recover.png "How to Remove Kaspersky Password Protection? [Easily Recover]")

