Tax Cuts Spur GDP Growth? Oh Really! Let's Just Take a Look
Red, White, and Blue - What Does That Bar Chart Tell Us About Taxes and Growth?
I was starting to write this hub about solving the deficit through spending cuts alone when I heard Senator Mitch McConnell, for the umpteenth time, say the Republican mantra about "cutting taxes always spurs growth in the economy", allegedly by putting more money into the People's hands to spend. Consequently, I got sidetracked into doing this hub. As an INTP, that happens easily!
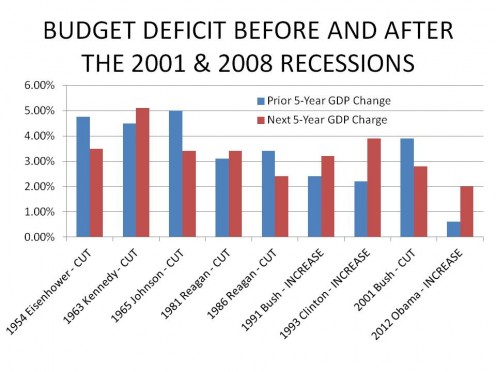
After a days worth of research and some calculations, I ended up with the Chart 1 below. In the process, I had a few preconceived notions blown away except for the primary one ... I didn't really think that tax cuts was as strongly tied to economic growth as the Republicans love to claim.
Addendum - Based on comments I received, I added as an epilogue - an analysis of each tax cut/increase from 1954 to 2001 at the bottom of the first part of this piece. If you are a glutton for punishment or just want to check on my assertions, have at it. A summary of the results, however is included in Part 1.
WARNING TO TEA PARTYERS and RIGHT-WING CONSERVATIVES: you might want to skip the analysis section as it might tend to upset your world or change your party affiliation! (Just kidding, I know you are as open-minded as the rest of us)
My Method
I will try to keep this upbeat and not too dry and numbery. The Conservatives, including the tea partyers, claim, constantly, that cutting taxes automatically leads to economic growth. You can't get through one political speech from them without hearing that statement.
Well, as it turns out. THEY ARE WRONG!!
What I did, the simplified version, was
- To gather up the annual percentage increases or decreases in Gross Domestic Product (GDP) from 1947 to 2010. GDP is one generally accepted way of measuring economic growth.
- I made sure the effects of inflation were removed so that we can compare each year in the same terms. (FUN FACT - Did you know that a 1947 dollar is worth $7.39 today?)
- I converted these percentage increases into dollars in order to measure growth over a period longer than a year
Next I researched when we had major changes in our tax policy and laid those dates against my column of GDP numbers.
In order to determine whether we experienced economic growth or not as a proximate cause of the change in tax policy, I looked at the 5-year period of GDP figures following the year of the change (the RED bars in the chart at the top or bottom). I compared it to the previous 5-year period before the change (the Blue bars in the chart at the top or bottom)
If there was economic growth as a result of a tax cut, then the growth in GDP in the 5 years following the cut should be greater than the GDP growth in the 5 years previous to the cut. Similarly, if there was a tax increase, then the reverse should be true; The growth in the next five years should be less than the previous five years.
IMPACT OF TAX CUT/INCREASE ON GDP GROWTH
What Are The Results?
SURPRISING, actually! To me at least. The chart is laid out with the earliest tax cuts/increase on the left and the most recent on the right. The Blue bars represent the annualized percentage growth in the five years previous the tax change and the Red bars represent the annualized percentage change in the five years following the tax change.
Also provided below the bars are the respective Presidents who were in power at the time, whether the change was a tax cut or a tax increase, and what year the tax change was passed.
So, what do we see? First we see that there were a total of 8 major changes in tax policy between 1954 and 2010. Six were tax cuts, 2 Democratic and 4 Republican, and 2 were tax increases, 1 Republican and 1 Democratic. Now look the pairs of Blue/Red bars. How many of them have the Red bar below the Blue bar? Four, right? That means that Growth Slowed after the tax policy changed and each one of those was a Tax Cut! In only two, Kennedy and the 1st Reagan cut, out of the six tax cutting circumstances was there actual growth in the GDP after five years! Wow, Mitch McConnell, John Boehner, Rand Paul, what have you been smoking??
Also notice that in the two times that taxes were increased, growth increased. That is 100% of the time!!! OK, so now I am acting like a politician ... it is only 2 out of 2 after all and one followed close on the heels of the other when coming out of a significant downturn under Reagan, The result isn't all that surprising but it does show that both Bush Sr. and Clinton did the right thing, even though Bush Sr. paid a heavy price for it with his own party.
Notice one final thing. The Johnson tax cut of 1965 and the Reagan tax cut of 1986 came two years and five years, respectively, after the previous tax cut. Both of those tax cuts ended up with slower growth.
Tax Cuts: Myths and Reality
- http://www.cbpp.org/cms/?fa=view&id=692
Link was suggested by Jeremey
President Trump's Tax Cut Proposal
President Trump is proposing cutting both Corporate and Personnel tax r dates for 2017. I will leave the details of it for future discussion; but I will mention two important aspects of it:
- Events in the first 100 days have forced President Trump to assert that his tax cuts (which reduce revenue) will be paid for with increased growth
- The conservative think-tank called the Tax Foundation estimates that if President Trump's tax plan is fully implemented, it will increase the deficit by 1 trillion dollars a year from lost tax revenue.
So the question is, will his tax cut grow the economy enough on a permanent basis to replace the one trillion dollar cost. The quick answer is no, it is virtually impossible. Of course I know you won't take my word for it, so here is my reasoning.
From the previous discussion about Chart 1 it is easy to see that tax cuts and GDP growth are poorly, even negatively correlated. On the other hand, tax increases and GDP growth are at least positively correlated.
But let's say the tax cut data is an elaboration, that the conservative are right and that tax cuts lead to GDP growth. The question then becomes "what would the rate of growth have to be for GDP to just break even?
The answer is that to add $1,000,000,000,000 to GDP year in, year out, the economy would have to grow at a steady 5.95% per year. How likely is this to happen? Not very. In fact, annual GDP growth came close to or exceeded the 5.95% rate only FIVE times since 1947; and never two years in a row!
The historic average growth rate since 1947 is just 3.1%. For a point of reference,
- President Obama achieved 2.02% from 2010, the first year of job growth;
- President Bush achieved 1.79% growth over all (but not counting the worse 6 months of the recession which 5 of those occurred after Bush left the White House.
- Clinton scored a hefty 3.78% and
- Reagan got 3.31%.
What Say You About The Future?
ONE should consider this history carefully when listening today's Republican House calling for even more tax cuts today so soon after this recession let alone extending the tax cuts on the wealthy.
If history is any guide, I would place my money on letting the tax cuts on the wealthy expire and wait until we have a healthy economy before considering additional tax cuts.
What do you say?
SUMMARY FROM EPILOGUE BELOW
- The analysis covers the period from 1954 through 2001 where there were six significant tax cuts and two significant tax increases.
- In four situations, economic growth was declining prior to the tax action, three of them before a tax cut, 1954, 1981, and 2001, and once before a tax increase in 1991.
- The other three tax cut cases, 1963, 1965, and 1986 and the final tax increase were preceded by economic growth.
- Federal Revenues results
Epilogue - Sponsored by eovery
IN the kind comment Eovery wrote, he pointed out that many other factors are involved in whether we experience growth over any given period of time. He is absolutely right. However, one can still analyze the Republican hypothesis that "cutting taxes leads to economic growth" based on the data I have presented.
First, let me apologize and warn. In the sections to follow, I present a lot more numbers in text form. I attempt to keep these at a minimum but when trying back up my claims, some will be needed. I hope the narrative that accompanies them is sufficient to keep your eyes open and your interest keen.
I have already mentioned the first top level indication, out of six tax cuts only two were followed by growth that was better than the preceding period, regardless of the reason. The four other times the growth declined, again regardless of the reason. So the question I would have is, what basis are the Republicans using to make their claim? It certainly isn't a top level view. From that perspective, tax cuts and tax increases seem to have the same effect. While, based on just looking at the graph, I can't say for certain, that tax cuts don't spur growth, I can say it with more certainty than the Republicans can say it does.
PRESIDENT EISENHOWER'S TAX CUT
Eovery also points out that certain events may have interrupted good intentions. So I looked into that a little. Starting with the 1954 Eisenhower tax cut, one would find that in the five year period prior to the cut, the first four were boom years, probably resulting from all of the money being spent on the Korean War. The last year, however, we went into a recession as that spending dried up and the troops came home. I would guess that might have been the impetus behind the tax cut. Nevertheless, the boom was so strong, the 5-year period showed a growth of 4.7%!
Eisenhower's tax cut was substantial. While it only dropped the top tax rate from 92% to 91% (and they are complaining today!) and, 23 tax brackets later, the lowests tax bracket from 22.2% to 20%. It was the middle tax brackets that saw the largest decline. You can see from the chart that this tax cut did have the desired effect, only 2.9% growth in the next 5 years. Why?
IN the last two quarters of 1954 and the first three quarters in 1955, there actually was good growth as the troops got back to work and the economy went from a war footing to domestic production. The same thing happened following WW II. But after that, the economy went into decline. For no particular reason that I can easily find, the economy floundered for the next six years with the exception of 1958 which, as Frank Sinatra once said, "was a very good year". So, were the good times in the couple of years after the tax cut due to the tax cut or Americans going back to work in an economy depressed by the previous war? Whatever it was, it was short lived.
Another astute comment by American Romance led me to generate the table below that considers the Federal receipts following the enactment of a tax cut or tax increase. In this case, we are looking at the effect of the 1954 Eisenhower tax cut. In this case, it doesn't appear the tax cut had the desired effect. Tax receipts actually fell, dramatically, from the year preceding the tax cut. In fact, receipts did not equal those received in 1953 until 1960! In only one year, 1957, did receipts actually exceed those of the year of the tax cut.
Federal Receipts (constant 2005 $)
Year
| Receipts ($ B)
|
|---|---|
1953
| 619
|
1954 (tax cut enacted)
| 599 (recession ends in May)
|
1955
| 544
|
1956
| 591
|
1957
| 603 (recession begins in August)
|
1958
| 567 (recession ends in April)
|
PRESIDENT KENNEDY
IN the few years prior to President Kennedy's tax cut, the economy was strong; GDP was growing at a reasonable rate. For the previous five years the GDP grew at 4.53% which is great by anybodies standards. After the tax cut, the economy continued to expand at 5.5%, almost too fast. Sustained growth like that can lead to inflation. So why the tax cut? I am not sure.
If my memory serves, I was about 16 then but politically curious, I think it was primarily due to most everybody but liberal Democrats being upset with the high tax rates. They still ranged between 20% and 91%. There was definitely a big push from the Right whose political power peaked a few years before but had momentum going their way. (Keep in mind, Right-wing Conservatives then, think Goldwater, are not from the same mold as those who call themselves that today; their mindsets are quite a bit different on how they approach getting their agenda into law.) As I remember, a tax cut was a big part of Nixon's platform and Kennedy tried to mitigate that with one of his own. The rest is history.
Kennedy won and enacted a massive tax cut. He took the top rate down to 77% from 91% and the lowest rated down to 16% from 20%. The biggest beneficiary again was the middle class with reductions as large as 16% points! He did manage to add two more tax brackets though, bringing the total to an astounding 25.
What was the result? Success this time. The tax cut fed into the growth that was already going on and magnified it. There was nothing happening in the world yet to upset the applecart. Vietnam was waiting in the wings, we had weathered the Bay of Pigs fiasco and the Cuban Missile crises, which could have undone everything, was history. From the chart below, you can see that federal revenues increased substantially from the increased growth apparently sparked by the additional capital flowing in from the middle class; just as the Republicans claim will happen ... but wait there is more (which I will get to after we look at some more recent examples of where it didn't work as planned.)
Federal Receipts (constant 2005 $)
Year
| $ B
|
|---|---|
1962
| $ 660
|
1963
| $ 675
|
1964 (tax cut enacted)
| $ 704
|
1965
| $ 721
|
1966
| $ 789
|
1967
| $ 875
|
PRESIDENT JOHNSON
TALK about being in the wrong place at the wrong time; mostly of his own making. Vietnam came front and center, the Great Society was born, and this was the season for massive social unrest in America. Nevertheless, save for 1968, after the 1965 Johnson tax cut we again see substantial growth in federal receipts.
What is in common with the Kennedy tax cut of 1963 is that it was large and that it occurred in league with substantial economic growth in the previous 5-year period. The growth was an amazing 6.58% and the tax brakets, reduced again to 23, was further lowered with the top rate going to 70% from 77% and the lowest rate went to 14% from 16%. Once more, the middle class got most of the benefits. Also, let me point out that this is still the era of massive write-offs, deductions, and tax shelters where many millionaires (when it meant something) and billionaires could get away with pay no taxes at all!
What is not in common with the Eisenhower tax cut of 1954 is that the Eisenhower tax cut occurred when the economy was winding down. The tax cuts were roughly the same size but growth in the 5 years previous to the 1954 cut was a robust 4.72%, it was actually negative the last 2 quarters of 1953 and the 1st quarter of 1954. Keep this in mind for latter analysis.
Like Kennedy, tax receipts soared! Unlike Kennedy, growth declined, sharply. Over the 5 years following the Johnson tax cut of 1965 the economy grew at a much lower, but almost normal, 2.76%. So what happened?
Lots of things converged which can be summed up as the precursor to one of the most turbulent economic periods in America until 2008. Further, one can argue that part of the blame for the turbulance can be laid at the feet of the Kennedy and Johnson tax cuts (which, remember, had the Republicans cheering loudly). What tax cuts are supposed to do is pump money into the economy. This works very well when the economy is humming along. But with growth, comes inflation if not planned for; sometimes even if it is. In this case it wasn't.
So what did Johnson, and later Nixon, face? A Vietnam war intertwined with social unrest that was getting out of control leaving the future uncertain and a drain on the economy. A war that was nowhere near the stimulus to the economy like WW II and Korean War were. Increasing inflation and increasing Federal Reserve rates to combat it, thereby depressing growth, and the impact of the Great Society. (I need to write a hub on this because I don't think Transfer payments like this harm growth, per se. In fact, I might be able to argue that it can help.)
In summary, probably four things combined to slow growth in the 5 years after the 1965 tax cut: 1) the transfer of capital out of the economny due to the Vietnam war, 2) the depressing effect of the large increases in the Federal reserve discount rate (up to 8%), 3) uncertainty as to where America was going, 4) the business cycle may have been coming to end anyway. In fact, the economy experienced negative growth near the end of the 5 year period.
Federal Receipts (constant 2005 $)
Years
| $ B
|
|---|---|
1964
| 704
|
1965 (tax cut enacted)
| 721
|
1966
| 789
|
1967
| 875
|
1968
| 867
|
1969
| 994
|
PRESIDENT REAGAN - PART 1
NOW it becomes personal. I was a two-time Republican voter by this point (I am not sure if I was eligilble for the 1968 election, but if I was, I think I would have voted for Johnson) and was a Reagan supporter in 1980. Not for his politics though, which were a little bit to far right for my tastes, but because the country needed uniting and he could do the job ... and he did.
It becomes personal, however, because after serving in Vietnam and getting out of the Army, I started one small business in 1975 and then another, a game store (war games of course, lol) 1978. Later, I sold the first one for a small profit. The economy was OK but inflation was still out of control. As it turned out, my timing was terrible; 1978 was the last good year for the next five years. The Federal Reserve, in order to get inflation under control, put the brakes on, HARD! By 1981, the year President Reagan introduced his first tax cut, the discount rate was a whopping 16.3%!!! By the 2nd quarter of 1982 we were in a recession. I still remember it being announced in the papers in June 1982, In July 1982, my sales dropped through the floor, By 1983, I was out of business (always one for irony, I closed on April 1, 1983) and by the end of the year, the whole gaming industry, manufacturers, wholesalers (including the one I sold my first business to), and retailers had largely disappeared. There are remnants around today, but not like what it was.
What got us in this position can probably be boiled down to a few things. Three of which were the unconstrained growth in the 1960s powered by two big tax cuts, the increasingly short-sighted thinking of the business/political communities, and THE OIL EMBARGO. The first two factors would have probably gotten us into trouble as they always do, but the oil embargo's impact on supply and price magnified the effect by a couple of orders of magnitude. It drove huge inflation and led to recession.
We had Stagflation ... inflation with a recession; a terrible thing for those of you who remember. I don't believe Stagflation had really raised its ugly head by the time President Reagan decided on a tax cut; that was part of his campaign. (Previously President Nixon had a tax restructure as well but he basically reduced the number of brackets from 24 to 15. The top and bottom rates remained unchanged although the cut-offs within the brackets did not.)
Now we have the Federal Reserve, which controls Monetary Policy, and the President/Congress, which controls Fiscal Policy, at loggerheads. The Fed is trying with all its might to restrain growth and bring inflation under control and the President is trying to do the political thing and increase growth. All the while oil prices, even though the embargo ended in 1974, were skyrocketing. The result was a mess and the Fed won. Federal income fell while outlays (think Great Society) increased leading to our first soaring deficit, as well as debt.
Surprisingly, the recession was short lived, even though it wasn't until 1986 when Federal receipts were larger than they were in 1981. Several things were in play in the 1981 to 1984 time frame.
- You had whatever the effect are going to be of the presidents tax cut starting in late 1981
- You had the Fed cutting its rate to around 10% in 1984, 8% in 1985, and 6% in 1986.
- Where the price of oil skyrocketed from 1973 to 1981, they plummeted even faster from 1981 to 1986. Sadly, they didn't come all the way back down.
- Now, you tell me, which had more impact on economic growth: plummeting oil prices, plummeting Fed discount rates, or a healthy tax cut? How much weight would you put on each? To here today's Right-wing politicians and their supporters tell it, 100% goes to the tax cut.
- Anyway, as a result, the economy grew beginning in 1983 and didn't stop until 1987. Growth for the period 1982 - 1986was 4.06% compared to the 5-year period 1977 - 1981 of 2.95%. Just for the record, the 2nd and 4th quarters of 1981 and the 1st and 3rd quarters of 1982 had negative growth.
I can't say the tax cut, which was substantial, was wasted, but it didn't live up to the Republican promises. Did it make the recession less of one? Maybe. It certainly put money into the pockets of those still earning it but the unanswered question is, was this money spent on consumption or was it spent on paying personal debt? In the former case, that spurs growth, in the latter it doesn't. Nevertheless, it can be said that within two years of the tax cut, the US experienced growth. What can't be said is the other half of the Republican claim is that tax cuts de facto increase revenue to the Treasury.
One thing is for certain though, the Republicans cannot point to this action as proof their philosophy works. Now let's look at President Reagan's second tax cut.
Federal Receipts (constant 2005 $)
Year
| $ B
|
|---|---|
1980
| $1,198
|
1981
| $1,251
|
1982 (tax cut enacted)
| $1,203 (recession ends in November)
|
1983
| $1,114
|
1984
| $1,174
|
1985
| $1,251
|
PRESIDENT REAGAN - PART 2
PRESIDENT Reagan's round 1 tax cuts took 15 tax brackets that spanned from 14% to 70% and compressed them into 14 tax brackets that spanned from 11% to 50%. Round 2, in 1986, reduced the 14 brackets into the more familiar 5 brackets of 38.5%, 35%, 28%, 15%, 11% and then in 1987 to 28% and 15%, In all of these moves though, there were many other changes tended to increase taxes such as the Alternative Minimum Tax to make sure the rich actually paid taxes, many didn't, and the elimination of certain items that can be deducted on Schedule A. Regardless, the overall effect was to lower taxes.
The environment was different. Reagan and the Republican and then Democratic Congress were on a spending spree. Prior to 1986, it was for defense. After 1986, entitlements began to raise its ugly, monolithic head. The Cold War was won and the race was on as to who could destroy the military the fastest, Democrats or Republicans. They both won, to America's huge disgrace. However, the real gorilla in the room was the deficit and the debt. It was working its way from infancy to adulthood.
(At the time, having lost my business to the 1981 recession, I did the next best thing, I started working for the government. Actually, a friend of mine and my ex-wife dragged me kicking and screaming into it but it was the best torture I ever endured! I ended up taking a job as a GS-4 Mathematician at McClellan AFB in Sacramento, CA right at the time when everything was blowing up about overpriced hammers and toilet seats. My base commander led up the task force investigating it.)
It would appear Reagan's second tax cut had leg 1 of the desired effect, it might have spurred increased revenue for the federal coffers. We probably should expect that if we look at the Kennedy and Johnson models of initiating a tax cut during a growth period. This is now our third example of where this works.
Did it, however, spur more growth, the second leg of the Republican model? Apparently not when you compare 2.63% growth in the 2nd five years vs 3.69% growth in the five years before that. But were there other factors? Maybe. Probably the most influential was the 1st Gulf War. It seems to have had a depressing effect on our economy. I certainly can remember the jitters of the stock market and oil prices. I believe the real problem, though, was the soaring deficit and debt, just like today.
The high point of the deficit was in 1983 and then again in 1986. Many measures were taken, including this tax cut, to increase federal revenue and decrease spending. It worked for three short years, from 1987 to 1989; receipts increased at a faster rate than outlays.
But it couldn't last. Other forces over took the temporary relief from the tax cut and the deficit ballooned in 1990. Receipts actually declined in 1991. Nevertheless, can the Republicans point to this tax cut and call it a success? Maybe. It did increase revenues, even though growth declined, and it was done in conjunction with spending constraints. It worked for three years at least. If their spending cuts had been more successful, maybe growth would have returned.
But as I just said, it didn't last and it caused President Bush Sr. to commit political suicide by raising taxes at the end of his term in 1990. From his point of view, a necessary evil but from the Democratic point of view it was just what the Doctor ordered.
Federal Receipts (constant 2005 $)
Year
| $ B
|
|---|---|
1985
| $1,251
|
1986
| $1,278
|
1987 (tax increase on lower and middle class, tax cut on rich enacted)
| $1,376
|
1988 (tax increase on lower class, tax cut on middle and upper class enacted)
| $1,421
|
1989
| $1,494
|
1990
| $1,509
|
PRESIDENT GEORGE H. W. BUSH
PRESIDENT Bush's tax increase was small, breaking the 28% into two brackets, a 28% and 31% bracket. It was passed at the very end of his second year. With that and a few other unpopular compromises with the Democrats, President Bush lost the support of right-wing and fundamentalist Christian-wing of his party. His loss in 1992 was all but guaranteed.
The tax increase was passed such that it effected the 1991 taxes which are to be paid in 1992. As you can see from the table below, tax receipts immediately increased. There was no apparent effect on growth as the before and after 5-year rates are about the same and both above 3%.
There wasn't much else major going on at time which would have a significant impact on the economy beyond the looming deficit and debt.. I was working in the Pentagon by this time for an office in the Secretary for Defense (OSD) involved in the review and assessment of the OSD and Service six-year budgets. I had the privilege of having a birds-eye view of the process from 1988 to 2008; what a sight!! The major fight in my arena was protecting the military and civilian budgets from stupid reductions by Congress ... notice I didn't identify a party, I don't need to.
The one thing that was set in stone during the final year of the Bush administration was the stark downward path of our military Force Structure. When the President Bush submitted his Budget to Congress in January or February 1992, we analysts just shook our heads. I can say this now, enough time has past, we all knew that by 1998, America's military would not be able to carry out its mission as laid out in the Strategic Plan. Therefore, I hate to burst the Republican bubble of blaming Bill Clinton for the sorry state of the military. They need to look to one of there own first! I must say though, Clinton still bears some responsibility as he could have changed things when he assumed office. He didn't until it was too late. Sorry for the digression, it still haunts me.
Where was I, oh yes, not much on the horizon to impact the economy so where do things stand? We have growing revenues, we have an economy that is growing, albeit only a little bit, and we finally have the deficit under control. All from a tax increase and some spending cuts he was able to get the Democrats to agree to, (in a fit of spite early on, the Republicans shot down Bush's tax increase/spending cut plan designed to shave $500 B off the deficit over five years) and, to be fair, the winding down of the Cold War.
In comes Bill Clinton.
Federal Receipts (constant 2005 $)
Year
| $ B
|
|---|---|
1991 (tax increase on upper class enacted)
| $1,473 (recession ends in March)
|
1992
| $1,468
|
1993
| $1,512
|
1994
| $1,612
|
1995
| $1,691
|
1996
| $1,776
|
PRESIDENT CLINTON
This should be a short one. Not much happening in the world besides Monica Lewinsky, the impeachment of President Clinton, and the Right-wing Conservative take-over of Congress. Economically, things are running along peachy-keen with one small exception; a still too big deficit.
The solution? One more tax increase which President Clinton pushed through while he had the chance. I think this was before his health care debacle. The tax changes were for 1993, the year he assumed office, but would show up in 1994 and beyond. As you can see from the table below, not only did revues increase, they were increasing at an increasing rate! This far surpassed any increase in outlays and by 2000 the budget surplus hit $269 billion. Ah, those were the days ... short lived ones though because Al Gore lost to George W. Bush.
What about growth? Where growth was a meager but still OK 2.29% under Reagan/Bush, it was a sustainable 4.2% from 1994 - 1998. I distinctly remember the remember the Right-wing Conservatives howling because Alan Greenspan and Clinton would not implement monetary and fiscal policies to push the rate of growth higher, to unsustainable levels like those of the Kennedy/Johnson years.
Talk about the right move at the right time! (My opinion, of course.)
There is one sour note, however. Near the end of his Presidency, the lynch-pin was pulled that led, again in my opinion, to our destruction in 2008 when, in 1999, President Clinton signed a compromise bill named the Gramm-Leach-Bliley Act which repealed the part of the 1933 Glass-Steagall Act that kept banks and financial institutions apart.
And along came Bush.
Federal Receipts (constant 2005 $)
Year
| $ B
|
|---|---|
1993 (tax increase on upper class enacted)
| $1,512
|
1994
| $1,612
|
1995
| $1,691
|
1996
| $1,776
|
1997
| $1,890
|
1998
| $2,041
|
PRESIDENT GEORGE W. BUSH
WHAT an unbelievably complex period this was, 2001 - 2008! We start with the cowardly terrorist attack on the Twin Towers and the Pentagon (I was driving to National Airport that morning to catch a flight to Boston when I heard the first report on the radio.) Then there is a significant tax cut followed followed huge increases in spending from three horribly mismanaged wars (I suspect a few die hards will disagree with me on that one), and capped by, in my opinion, a predictable economic meltdown. Not bad for two terms.
In the tax cut arena, what do we find? Did the tax cuts work as designed? I am again stuck with a maybe. Once again the predictable happened and tax receipts fell below 2001 levels and didn't catch back up until 2006. Why? Because they followed an economic downturn in 2000 and 2001 with a tax cut. This happened in 1954, 1981, and now in 2000; do we see a pattern yet? Aren't the Tea Party and Right-wing Conservatives once again screaming for a tax cut to solve the world;s, or at least America's. problems? They need to look at history.
How about on the growth front? My chart shows the previous five years being better but really it is flat; I am not sure I can tell the difference. The only thing I can say for certain is it wasn't worse and it wasn't better.
So, was the tax cut worth it? Here I need to say no. I say no only because it destroyed the surplus Clinton managed to start. Would tax receipts been worse? One has to wonder as our only data point is George H. Bush's tax increase following a weak economy. Tax receipts grew and the deficit decreased. I would certainly like to give that another go, for sure. There is no doubt the reverse isn't working. What say you?
Would growth have been different? Don't know. I only know that in George H Bush's example they improved a bit. Given the number of "I don't knows", I think I would have like to stay with the bird-in-the-hand budget surplus. What say you, again?
Federal Receipts (constant 2005 $)
Year
| $ B
|
|---|---|
2001 (recession ends)
| $2,215
|
2002 (tax cut for lower class, smaller cut for rest enacted)
| $2,029
|
2003 (tax cut enacted)
| $1,901
|
2004
| $1,951
|
2005
| $2,154
|
2006
| $2,324
|
2013 TAX INCREASE
AT THE END OF 2012, Congress finally reached a compromise which, among other things, increased the marginal tax rate on those earning $400,000 or more back to the Clinton era rates. It will be sometime before it can be determined if it had a positive effect on tax revenues and economic growth, but we should quickly see if it has the negative effect predicted by most conservatives.
PRESIDENT BARACK OBAMA
What President George W. Bush started, President Obama both finished and ended. To get his tax cut passed, it was made temporary, with the provisions expiring during Obama's term in office. The thinking was, as I remember, that Congress wouldn't have the nerve to let the tax cuts expire - and they were partially right.
The final compromise Obama struck with the Republicans was to let most of the middle class tax cut become permanent, but roll back the tax cut for the rich. Specifically, the compromise left the tax rates for singles earning $400,000 ($450,000 for family) or less as is. For those earning more, it returned the maximum tax rate back up to Clinton's 39.6%.
Now prior to the 2013 Fiscal Cliff Tax Cut, as it was called (and was really an extension of cuts coupled with a tax increase), you had the fiscal stimulus "tax cut" in 2010. This amounted to a barely noticed $400 cut for singles and $800 for families. They saw the cuts in terms of lower withholding taxes. This was part of a much larger stimulus package designed to keep America out of a depression and restore confidence in the American economy - it worked.
So, what was the impact of the 2013 tax cut extension/increase? Let's see.
Federal Tax Receipts (constant 2005 $)
Year
| $B
| |
|---|---|---|
2011 (recession ended in 2009)
| $2,018
| |
2012
| $2,105
| |
2013 (small middle class tax cut and tax increase on rich)
| $2,356
| |
2014
| $2,503
| |
2015
| $2,715
| |
2016
| $2,691
|
PRESIDENT DONALD TRUMP
Donald Trump promised a massive corporate tax cut from the beginning of his campaign, Stock traders finally believed him, which accounts for much of the additional rise in the market over and above what would normally have happened with the trend that President Obama set. In the beginning it was never sold as a middle class tax cut, it was aimed directly at corporate America.
The putative corporate tax rate was 35%; it was said, mainly by corporations, that it put them at a distinct competitive disadvantage with their foreign counterparts. In fact, most corporations effective tax rate was around 27.1% (compared to 27.7% for their foreign competition). The corporate rate was to be cut to 20%.
After Trump won, then the hard work of trying to sell this to the American people began. It was sold as a middle class tax cut and Trump and the Republicans downplayed the massive tax reductions corporations and the wealthy will get. The middle class actually saw little in the way of reductions. What they did see was higher ACA premiums because the insurance mandate was removed in another attack on the now popular Obamacare. It also made rosy promises on how much GDP would grow because businesses would reinvest their new found wealth back into their businesses and hiring.
Neither happened to the degree promised. Instead, corporations returned their proceeds from the tax cut mainly to stock holder in the form of stock buy-backs and higher salaries for senior executives. There was a flurry of headline making by a few corporations for one-time bonuses for the rank-and-file as well as a few more permanent pay raises. But didn't spread throughout corporate America.
It is too soon to tell what the final scorecard will look like. But going into the end of the 2019 fiscal year, the Treasury announced that because of lower then expected federal receipts, they moved up the date the government is going to run out of money to pay its debts by almost two-weeks. Congress now has less than two months to raise the debt ceiling and they are going on a one month holiday.
Federal Tax Receipts (constant 2005 $)
Year
| $B
| |
|---|---|---|
2017
| $2,671
| |
2018 (Tax cut passed)
| $2,622
| |
2019 (estimated)
| $2,668
| |
2020 (budgeted)
| $2,845 (based on tax cut assumptions)
| |
2021 (budgeted)
| $3,009 (based on tax cut assumptions)
| |
2022 (budgeted)
| $3,205 (based on tax cut assumptions)
|
BOX SCORE
Summarizing the results of tax cuts and increases over the last 50 years provides us this little chart.
FOLLOWED BY
| INCREASE REVENUES
| DECREASED REVENUES
| GDP GROWTH - Previous 5 Yrs < Next 5 Yrs
| |
|---|---|---|---|---|
TAX INCREASE (3)
| 4
| 0
| 4
| |
TAX CUT (5)
| 2
| 2
| 1
| |
I counted the Kennedy-Johnson cuts as one continuous cut. Reagan's 1st cut did not change revenue.
© 2010 Scott Belford

