Chasing UFOs? Current Hotspots and Daily Trends for Close Encounters Examined

So What's Up With Tuesday?
A couple of interesting bits of information cropped up while writing a recent hub. The biggest one was that June 2012 had 1.8Xs more sightings numbers when compared to the average number of sightings for that month during the prior decade (based on raw NUFORC sightings report data). Another discovery was that Tuesday was a big day of the week for close encounter sightings (based entirely on MUFON report data).
However, although most of the review of that month was done by combining only filtered data (excluding 22-25% of the reports that were either duplicates, likely IFOs or didn't pass the smell test) from both MUFON and NUFORC, just the raw data from MUFON was used when the days of the week analysis was done for the close encounters.
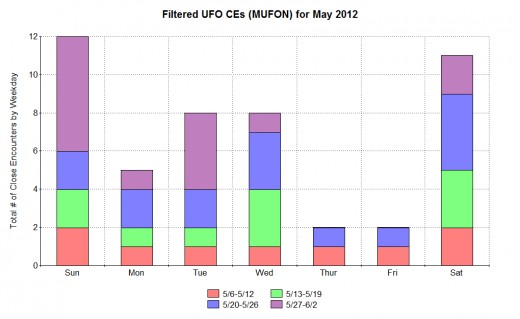
I decided to study the figures for May 2012 and compare them to those for June. In doing that I screened out 15.5% of the close encounters for the period of May 6 through June 2 (or rejected 10 reports out of 58). From that data there were definite peaks for Saturday and Sunday and a secondary peak on Tuesday and Wednesday (see the illustration above).
This time I also sought out daylight sightings within the close encounter reports. What I found was that only 2 out of the 48 or 4.2% were daylight sightings. Since, if dawn and dusk time is counted as well, there is twice as much daylight hours as night hours at this time of year in the US (on average), this means that the number of night sightings per hour is 46Xs greater than the hourly rate during the day. The difference between the two isn't nearly as extreme when looking at reports in May from Larry Hatch's *U* UFO Database (only 2.8Xs greater at night for all significant reports). After some thought I realized that the *U* database is highly filtered and has a strong bias against distant nocturnal lights. Since the vast majority of those sightings were likely rejected for that database, and they account for the vast majority of sightings, it would be expected to display less of an extreme difference between the sightings at night when compared to those during the day.
Similar to a much greater frequency of sightings occurring at night than during the day, there also appears to be an increase in sightings on the weekend. This is similar to the much greater increase experienced during July 4th in the U.S. (in both cases there are more people outside to witness any UFO event but much more so on July 4th than on the weekends). Interestingly, there was a big increase in sightings during the last New Years Eve (or the night of 12/31/11 to 1/1/12), which also happened to fall on a Saturday night.
Although technically the Saturday and Sunday peaks for the close encounters in May were significant (being 1.6Xs and 1.75Xs greater respectively than the weekday average during the period studied), it is my belief that the Tuesday peak (1.17Xs the average) was perhaps more important. This is not only because it occurred when there would have been less people out and about to witness any potential sightings, but because something else happened then that set it apart from the other days.
The two sole daytime close encounters, out of the 48 close encounters selected, occurred on Tuesday (during the 28 day period from 5/6-6/2/12). They comprised 25% of the 8 close encounters that happened on Tuesday. They also represented half of the four close encounters that occurred on Tuesday, May 29 (one was in Missouri and the other in Virginia). The most active days during the 28 studied for the close encounters were Saturday/Sunday on May 26 & 27, and Tuesday May 29.
Although Wednesday, like Tuesday, also had 1.17Xs the weekday average of sightings, its noteworthy peak isn't as significant. My reason for reaching that conclusion is that there are many UFO hunters out there who believe in John Keel's Wednesday phenomena and so are out seeking a UFO sighting more then than on any other weekday (other than Saturday night). Actually the high number of reports on Sunday is a bit higher than expected (it would seem more likely on a Friday night) and may be attributable to multiple peaks in at least two of my proposed UFO day cycles (as presented in many of my prior hubs).
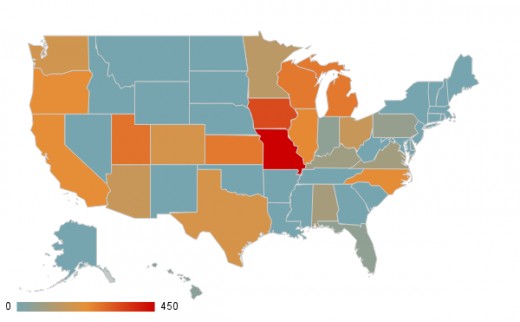
Since the four days from 5/26-5/29 averaged 2.2Xs more close encounters per day than the average daily rate for the whole 28 day period reviewed (as well as averaging 1.3Xs more for all filtered sightings during those four days when compared to the full 28 day period), I decided to map out the data for just those four days rather than for the whole month. Although the results suffer a bit from lack of data, it benefits by having more signal and less noise.
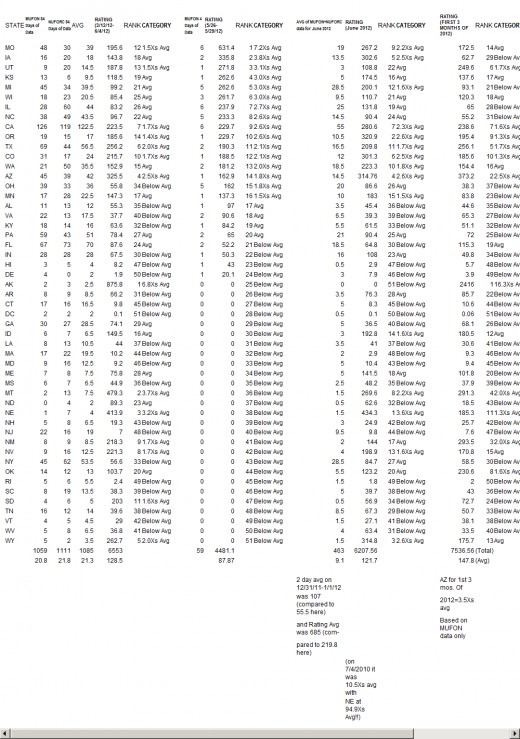
Examples of states that may vary significantly from their ranking (due to low report numbers and population density) in the spreadsheet shown below are Utah and Kansas (likely to be lower in rank) and Arizona and Minnesota (likely to be higher in rank). Virginia, just north of highly ranked North Carolina could likely be ranked higher as well due to the fact that I used only 2 of its 4 reports and also due to the fact that 1 of the 2 reports used was one of the only two daylight sightings out of the 48 close encounters studied.
States ranked in the top 20 with close encounter reports (using filtered MUFON sightings report data):
Missouri (rank=1) with 1 (day) out of 6 (16.67% or possible downgrade), Iowa (rank=2) with 1 out of 2 (50% or about right), Utah (rank=3) with 1 out of 1 (100% or about right), Michigan (rank=5) with 2 out of 5 (40% or about right), Illinois (rank=7) with 2 out of 6 (33.33% or about right), North Carolina (rank=8) with 2 out of 5 (40% or about right), Colorado (rank=12) with 1 out of 1 (100% or possible upgrade), Washington (rank=13) with 1 out of 2 (50% or possible upgrade), Ohio (rank=15) with 1 of 5 (20% or about right), Minnesota (rank=16) with 1 out of 1 (100% or possible upgrade), Virginia (rank=18) with 1 (day) out of 2 (50% or possible upgrade), and Pennsylvania (rank=20) with 1 out of 2 (50% or possible upgrade).
States in the top 20 without any close encounters (MUFON filtered data):
Kansas (rank=4) with 1 (possible downgrade), Wisconsin (rank=6) with 3 (about right), California (rank=9) with 6 (possible downgrade), Oregon (rank=10) with 1 (about right), Texas (rank=11) with 2 (possible downgrade), Arizona (rank=14) with 1 (about right), Alabama (rank=17) with 1 (possible downgrade), and Kentucky (rank 19) with 1 (possible downgrade).
My rankings (top 18) based on the above considerations:
Iowa, Missouri, Michigan, Wisconsin, Utah, Kansas, Illinois, North Carolina, Colorado, Oregon, Washington, Minnesota, California, Virginia, Arizona, Texas, Pennsylvania, and Ohio.
Also worth considering is that for all report days during the 28 days reviewed, May 19th had the most sightings with a total of 39 (in 2nd place was Sunday, May 27th with 32 and in 3rd place was Sunday, May 20th with 31). When looking closer at the data for that day however, there were more than the usual number of reports that I rejected (42%) than is typical for a busy UFO day. A large number of the close encounter reports were also rejected (57%), resulting in an insignificant 13.6% of the filtered total for that date (14.8% is the average for CEs in the 28 days of the study). If I had rejected one less close encounter report (I used 3 out of 7) then the percentage of CEs would have risen to the level of that seen during the May 26-29th period (plus the CEs for Saturdays would have risen to 12 or the same number as for Sundays). The only states with close encounter reports that I considered useable came from Oregon and Michigan. Those states were also ranked at number 1 and 2 respectively for that date. The filtered numbers for May 19 were 22 reports (1.9Xs the filtered daily average) of which 3 were close encounters. My estimate for the filtered daily average for the entire 28 day period is between 11 and 12 sightings and the daily average for the highest 4 day period of 5/26-29 (at least for CEs) comes out to 14.8 sightings.
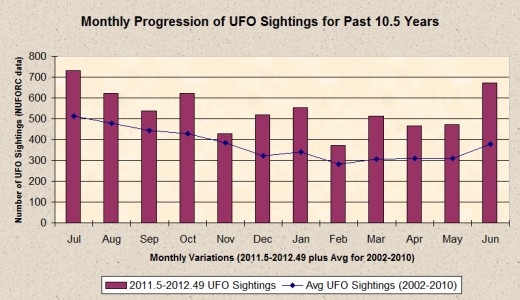
The graphic below shows the monthly breakdown of UFO sightings for the past year and compares that data to the monthly averages for the nine year period from 2002-2010 (all numbers derived from raw report number tallies from NUFORC). Although the monthly numbers for the first half of 2011 were nearly identical to the average figures for those months gleaned from the nine years just prior to it, the last half of 2011 had results that were 1.35Xs higher than the average figures for the same months. It is noted by me with extreme interest that the first half of 2012 represents UFO report numbers that are 1.57Xs greater than the averages for the same part of the year. If this trend continues then it would not be a surprise to see the second half of 2012 result in 1.8Xs more reports than the expected average (or the same figure as was attained in June 2012). If we see an increase of at least that for the last half of 2012 then there should be no less than an average of 169 more reports per month than each month's average figure or 95 more than the same month for last year. In my opinion a true wave of UFOs is an increase of at least 2-3Xs that of average numbers. Although the projected increase comes close to that it does not quite rise to that level. However, during the last half of the year there is statistically a greater chance of a spike of 2Xs that of normal (or higher) than would be the case in the first half of a given year. In other words, the last half of this year has good potential for producing a UFO wave of 1-2 months duration. So, to put it another way, it might be time for NUFORC and MUFON to hire some part time workers.
Due to a sparse amount of data available to come up with the state rankings for the May 26-29, 2012 period, I decided to include another map showing UFO concentrations by US states utilizing the average of the MUFON and NUFORC data (using 51 out of 69 reports or 76% for the later set of sightings). The results of this, due to low population density for Montana and Nebraska gives them inflated figures. They may still be in the top five but the exaggerated rating values cause the 9-16 rankings to be given an average category when they should probably be considered above average.
")

UFO Activity in June 2012 in Review (A Record Month!)
- UFO Sightings Weather Report for June 2012
If you haven't already read it, one of my recent hubs looks at a significant increase in sightings in June 2012 that wasn't quite a wave but may be leading up to one this summer.
© 2012 Joseph Ritrovato


