When Google Analytics isn’t Everything: How to Deal with Multiple Website Analytics

Even if one is working for oneself, one must carry a monthly report on the progress of one’s web sites and social media profiles. The documents that outline how we're going to approach the strategy, and, later, how are we going to streamline this process should all be given attention.
For instance, a metrics register explaining what service measures what metric in which website or profile or a list of the things we’ve automated in our strategy.
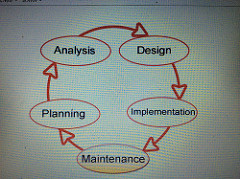
Some might even need a workflow of the measuring strategy. A document or diagram with sections detailing each tactic, that due to its complexity would be otherwise forgotten or hard to learn to fulfill by memory.
I believe that if one is working with digital analytics at the professional level, then it’s better to err on the overkill side, rather than mismanage things.
It’s a complex, and big subject and one requiring the integration of strategy, tactics, and planning. Much more so if one doesn’t have an integrated solution and has to rely on dozens of web apps, like in my case.
Carrying a Measurements & Statistics Diary

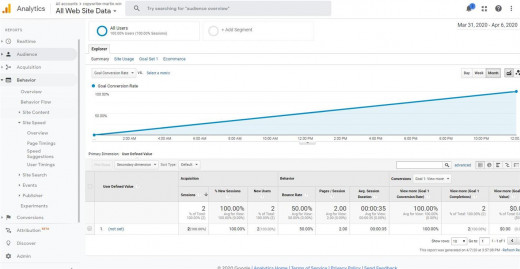
Take for instance, Google Analytics. Its customization capabilities are way too granular. The only efficient manner of using it, as I see it, is carrying a diary detailing everything about a determined web property’s GA Strategy.
Bear in mind that GA is just one, and when you use more than one provider for digital analytics, then you’re going to need other documents to organize it all.
The measurements diary is a good start. Some possible sections for it could be:
Metrics Choice
Where we write down the shortlists of the metrics we want to measure. Examples would be one’s own KPIs or other statistics that digital analytics measure.
Metrics Waiting List
Where you keep all the metrics you’d like to use but haven’t got around to yet. If things get out of hand, you can always migrate the data to a worksheet.
Features To Implement
In this section, you jot down all the ideas for tests and to-dos for future measurement implementations.
It’s worthy of note that Google Analytics is useful not just to measure websites.
A lot of other kinds of things can be measured. The list of things on which one can integrate Google Analytics is beyond the scope of this post.
Curating Notes
When you have your analytics up and running for some time you start to find all kinds of cool things about whatever you’re measuring.
You will also start to see the gaps in the property’s performance. Or in the business strategy you're using to achieve your goals.
This section would hold all your observations about the experiences in your measuring journey.
Improvements
Finally, further curating of your curated observations.
You could write in this section what are you going to do about the property’s shortcomings; how you're going to bridge the gaps, or change your strategy.
Carry More Organizational Documents

I was going to include a register of automated reports in this section of the article, but I guess it would be easier to add a column to the metrics register where we will record the automation status of the report. Either automated status, when we're receiving the report in our mailbox, or non-automated, when we have to load a web page to see the numbers.
Metrics Register
It may happen that after one selected a list of metrics, one finds out that there isn’t a single, integrated way of monitoring them.
Enter free web apps. Like in my case, using stats pages native to the app, GA, StatCounter, and a few third-party ones, like Tailwind, IGBlade or Union Metrics.
Many web apps give many types of metrics. From statistic solutions usable at the front-end level of business to integrations with site analyzers to optimize websites at the technical level and measure their performance through time.
If you follow an approach like mine's things are going to get messed up rather quickly. For me, the solution to having to deal with multiple providers of analytics was to create a metrics register.
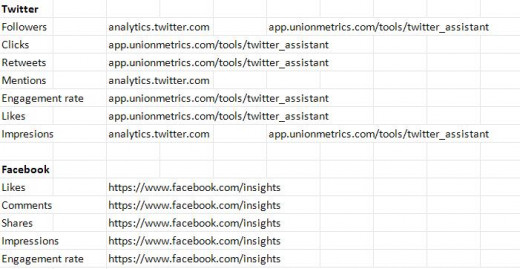
Using a spreadsheet we lay out each channel, for instance, a site or a social media profile, as a parent.
With the childs of the channel as the metrics in the first column, and in the second one, we make a record pointing to the page that has the statistics for that metric. Like in the image at the head of this section.
For added curating, ease and automation, we can bold out the services that kindly offer an automatic, periodic reporting measure.
Measurement & Statistics Workflow
To record the sequence in which we are going to proceed when the time to do the report comes. It can be something in-depth, contemplating monthly reports but also more frequent monitoring checks.
I use an outline of the tasks to fulfill to be able to fill all of the report's blanks.
- Check reports in the mailbox, enter the figure in the report, delete the email
- Check reports in the native feature the of the social media profile or site, and enter the figure in the report
- Check specialized statistics directly on the web, like Google Analytics, enter the figures in the report
- etc
End Product of The Strategy: Actionable Reports

At the end of the day, we need something concrete that goes beyond whatever statistics we gather mentally and visually from reading results in web apps.
Analytics are relatively useful to read from the web. Still, they're not powerful if we don’t transplant them to customized personal documents.
We need a personal and created by ourselves monthly report that will give the hard facts about the performance of our sites and social media profiles.
An integrated document that allows us to see:
- How and what changes from month to month,
- Are our KPI goals are being met?
- Where we stand in contrast to the previous months’ results?
- More...
In the title column goes the name of the channel, for instance, “corporate website”. Then in this same title row, I place the metrics I’m going to measure.
The way I do my monthly reports is to have a worksheet with all the channels I measure. The columns are the metrics, the rows are the month's results for each metric.
In the column below the name of property/channel, I put the month of the report. Obviously, below each metric goes the number I achieved for that month.
Outro

I hope all this made sense. It's just my way of dealing with a few things:
- Not having the technical know-how and/or the time to create my own analytics solution, from scratch or to learn to mine all the analytics I need on GA
- Not having budget to allocate to an integrated solution like, say, SumAll
- Not liking to go through the additional overhead and potential failure points that a dashboard program like Freeter or similar ones provoke


