Google Analytics: How to Easily Display and Export More Than 500 Data Rows at One Time

You can display and export the number of data rows that you want
When you're working in Google Analytics, and would like to export the rows of your report, there is a limit in the export option. If you use the reporting as it is displayed, you can only export up to 500 rows at any one time. That can be very frustrating if you have a lot of data rows. You would have to export them in 500-row sets, then paste the sets together.
However, there is an easy work-around for avoiding this cumbersome and time-consuming situation.
I'll use the Landing Page report as an example.
Suppose you have 2,000 rows to export for a landing report.
Instead of exporting it in 500-row pieces, and pasting them together, do the following:
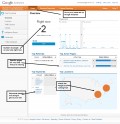
At the bottom of the page, look on the right for the total number of rows in your report.
After you've found the total number of rows, change the
"show rows" entry to 500 and make sure the Goto box is set to 1
Then go up to the URL line.
Don't be concerned that you don't know what the Google Analytics address means.
Click once to put your cursor at the end of the URL. Then use the left arrow to find the part of the URL address that says
explorer-table.rowStart%3D0%26explorer-table.rowCount%3D500/
Table.rowStart with a 0 after the %3D means that your report will start with row 1. You caused that to be your first row when you made sure there was a 1 in the Goto box at the bottom of the page.
Table.rowCount with a 500 after the %3D means that currently the page will only display and export 500 rows. This number is displayed because, at the bottom of the page, you changed the number of rows to be displayed at 500.
Place your cursor on the last zero in 500. Backspace to remove 500. Then type in the number of rows you really have. In this example, that number is 2000 .
Press enter.
If you have several thousand rows, it will take a while to load.
After the loading is complete, scroll down and you should see all of the rows of your report displaying. (I don't know if there are some upper limits on this, as I only have 40 hubs.)
Use Google Analytics export to work in Excel
Now you can do the export as you normally would.
Before you do the Export, you can sort the displayed rows on the webpage. Pick a column to sort your report by. Click on that column heading once if you want the report sorted in ascending order by that column. Click on it twice if you want the report sorted in descending order by that column.
Press the down arrow next to the Export command (about 3 lines down from the orange menu bar at the top of the page.)
You will see 4 options for exporting. Just from habit, I normally do CSV. You will be prompted to save or open your file. If you have MS Excel, you can open the file and work with it instead of saving it first. I suspect that you can do the same with other types of spreadsheets, but I don't have them so haven't tried it.
The rows will be exported, along with some header information at the top of the spreadsheet. When MS Excel opens with the exported rows, place the cursor in the first column of the first row of your data (below the heading information).
Press the End key. (Don't hold it down.) Then press the down key. The cursor should move to the last row of your data, and the Excel row number will equal the number of rows that were in Google Analytics, plus the rows that were used before the your data for the headings at the top of the spreadsheet.
Now, save the file. After locating the folder you want to save the file in, change the file type to Excel workbook, and you're ready to really look at your data.


