Indifference Curve Analysis of Demand


Introduction
Indifference curve analysis or technique is one of the modern tools for studying about the consumer behavior or demand. In the day to day life of human beings, many things are demanding. People have to satisfy some urgent wants. Similarly they may also have to satisfy some irrelevant wants too. For this purpose, they use their income or money resources to buy commodities. Generally, it is a phenomenon in the economy that the human wants are unlimited while the resources to satisfy them are limited. Here the consumer is compelling to select his wanted commodities from various choices available for purchasing. The consumer would also try to get maximum satisfaction from his available choices. Here this hub is provided a brief explanation about the indifferent curve analysis.
Assumptions of Indifference Curve
The indifference curve technique was developed by two great economists, J.R Hicks and R.J.D Allen. Later it used for wide applications in the various economic analysis. The analysis of indifference curve is based on the following assumptions.
a) The consumer is rational
b) The consumer will try to get maximum satisfaction or more bundles of commodities from his given income.
c) The consumer behavior is transitivity. That is he will be consistent in his choice. For example, if a consumer thinks that Apple is superior to Mango and Mango is superior to Orange. Then he will be determined to purchase Apple.
d) Indifference Curve analysis is based on diminishing marginal rate of substitution. Marginal rate of substitution means the rate of one commodity changes with respect to increase the consumptions of other commodity.
Indifference Curves
By definition, Indifference Curve means, "the locus of combinations of commodities, which will gives the same level of satisfaction to the consumer at a given level of income. A consumer can buy any commodities he wishes, but within the constraint of his income. Suppose the consumer wants to buy vegetables and fruits. He can buy them with various combinations like equal quantities of both or more fruits and fewer vegetables or less fruits and more vegetables. For better understanding the concept of indifference curve and its derivation is mentioned with the indifference schedule given below.
Indifference Schedule
To derive indifference curves, first of all consider the indifference curve schedule of two commodities given below. Here the commodities are good X and good Y.
Indifference Curve Schedule
Combination of Commodities
| Good X
| Good Y
|
|---|---|---|
A
| 30
| 2
|
B
| 22
| 4
|
C
| 16
| 6
|
D
| 12
| 8
|
E
| 10
| 10
|

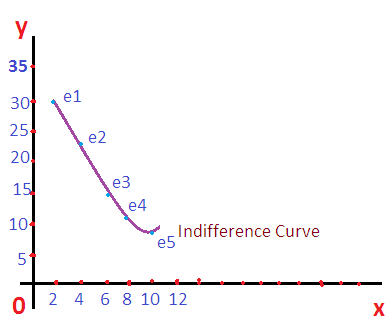
From the above table, there are five combinations available to the consumer (A to E). If the consumer chooses combination A, he can buy 30 units of good X and 2 units of good Y. If the consumer wants to buy more unit of good Y with the same income, he must substitute some quantities of good X. Similarly, at each combination, the consumer is required to sacrifice good X for buying more units of good Y. when we represent the above indifference curve schedule in a graph, we can derive indifference curve. The indifference curve is based on the above table is given below.
Diminishing Marginal Rate of Substitution
Diminishing marginal rate of substitution is one of the important features of indifference curves. By meaning, diminishing marginal rate of substitution is the unit of one good substituted for purchasing of an extra unit of the second good. The concept of diminishing marginal rate of substitution can be explained based on the above indifference schedule. See the following table.
Indifference Curve - Diminishing Marginal Rate of Substitution
Combinations of Commodity
| Good X
| Good Y
| Good X Substituted for Buying of Extra Units of Good Y
|
|---|---|---|---|
A
| 30
| 2
| --
|
B
| 22
| 4
| 8:2 = 4:1
|
C
| 16
| 6
| 6:2 = 3:1
|
D
| 12
| 8
| 4:2 = 2:1
|
E
| 10
| 10
| 2:2 = 1:1
|
When a consumer shifts to new combination or buys an extra unit of good Y, he must reduce the consumption of good X. Here at each stages of buying of an extra unit of good Y, the rate of sacrifice or substitution of good X is decreasing. This is the concept of diminishing marginal rate of substitution.
Features of Indifference Curves
Indifference curves have some features. They are listed below.
a) Indifference curves are convex to the origin
b) Indifference curves have negative slope.
c) Different indifferent curves never intersect with each other
d) Higher level of indifference curves shows higher level of consumer satisfaction. The reason is that, at the higher level of indifference curve, the consumer can buy more commodities. But there may be many constraints to the consumer to buy whatever he wishes such as limited income, higher price of commodities etc.
Related

How Do Income Effect, Substitution Effect and Price Effect Influence Consumer's Equilibrium?

Indifference Curve Analysis vs. Marshallian Cardinal Utility Theory

Indifference Curve Analysis: Assumptions, Indifference Schedule and the Meaning of Marginal Rate of Substitution

Relationship Between Average and Marginal Revenue Curves

Consumer’s Surplus: Meaning and Measurement


