Quantitative Data
What is Quantitative Data?
Quantitative data is data that can be quantified and expressed as a number. Quantitative data is measured, counted and easily analyzed.
For data to be quantitative, it must have a definite scale of measurement, be it Kelvin, nanometers, feet or Farads.
Quantitative data and qualitative data can be collected simultaneously, measuring or documenting different attributes of the same products or processes. Qualitative data collection is repeatable. Different people using measuring equipment should get the same or very similar values for the same qualitative variable.

Relationship Between Quantitative and Qualitative Data
Qualitative data measures or classifies qualities, such as gender, race, citizenship or religion. Quantitative data measures quantifiable values such as age, weight, height or white blood cell count. Qualitative and quantitative data may be collected simultaneously, such as checking off “yes/no” binary questions like “Are you married?” and “Do you have children?” along with someone’s age and time spent at their current residence in a sociological study.
Qualitative data collects information that adds depth and reveals deeper trends than quantitative data may reveal. For example, a trend of increasing weight with age is better understood when it is correlated to qualitative data such as marital status, having given birth to children or starting college. In databases, qualitative attributes like gender and notes about someone's health are recorded alongside quantitative data like blood pressure and recorded heart rate.

Analyzing Quantitative Data
Some of the most common statistics are used to analyze quantitative data. The mean or average is found by totaling the quantitative data and dividing by the number of data points. The median is found by arranging all data points in order from smallest to largest and then finding the middle one. Medians identify a middle value without being skewed up or down by extreme values in the data set.
For example, a single billionaire in a town will dramatically increase the average net worth in a small town, but his or her influence will hardly affect the median net worth. The range is found by subtracting the largest value and the smallest value. The range is a simple value that indicates the extremes of the data set.
Variance measures variation within a sample relative to the mean or average. Standard deviation measures the dispersion of the data. Standard deviation is found by taking the square root of the variance.
Extrapolation is the process of determining the mathematical equations that tie the quantitative data points together. Equations derived from quantitative data analysis are used to predict future behavior of a system.
Concerns about Collecting Quantitative Data
While qualitative data may be gathered through check sheets or story boards, quantitative data gathering is easily automated. Whether dimensions are captured by automated cameras or digital scales, quantitative data is routinely captured through electronic or computerized means. This simplifies later quantitative data analysis. However, automated data collection does not eliminate all possible concerns about gathering quantitative data.
When collecting quantitative data, the best results occur when data collection is complete. All questions or measurements should be collected in each sample or interview. A second consideration is accuracy. Was the measurement taken correctly, resulting in the actual value? Data collection should be performed using a standard and repeatable methodology. The same time interval or sampling rate must be used throughout the study.
Whether collecting quantitative or qualitative data, it is important to avoid selection bias. In selection bias, the sample is not random and thus biased. For example, allowing those who belong to a specific religious or ethnic group to self select for a study on that group could lead to those who see themselves as good examples of the community to answer sociology studies. The results of the study will generally be better than a random selection of members of the community.
Conversely, an academic study on tutoring or remedial curriculum based on parents who choose to join could yield a population whose members are doing unusually poor with more motivated parents than average. The children would have lower scores than the average group, since the children who are doing relatively well in the class probably would not join the study, while parents who are not motivated to improve a child’s performance will not join.
The fact that the data is quantitative instead of qualitative does not eliminate the risk of selection bias in the study. Using scanners to grade children’s tests and tabulate the results does not eliminate bias if the student sample itself is biased.
Presentation of Quantitative Data
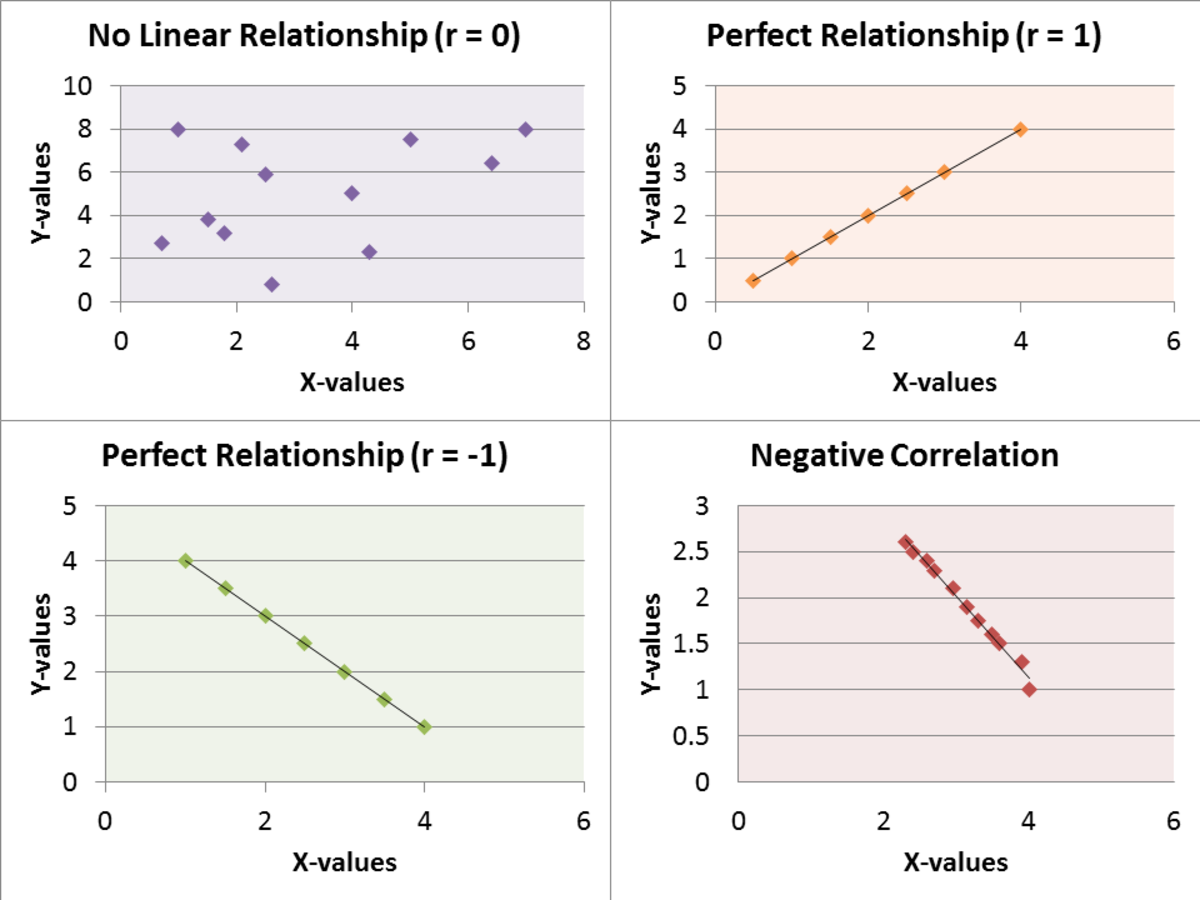
Quantitative data is often presented as data points on a graph or chart. Run charts track a single quantitative value over time.
Statistical process control charts or SPC charts are line charts that show the value of a quantitative variable over time and relative to acceptable limits or control limits. Box plots depict both averages and ranges. Furthermore, quantitative data can be presented in almost any type of chart.


